
Analyzing Performance
You are looking at an older version of the documentation. The latest version is found here.
Performance Perception
Performance of queries might be different for result sets in the Data Virtuality Studio. A user might see the result of a query very quickly. This is because results are streamed to the Data Virtuality Studio. If a bespoke query is then joined to another dataset, it might need to be evaluated entirely and suddenly take more time than expected. The same applies to replicating data: the first batch of the result is shown very quickly, but the replication will have to evaluate the whole query and transport to the destination is added to the duration of the replication job.
Using the Monitoring Tool
The performance of single queries can be analyzed using the web-based monitoring tool. If a query is selected, the following information about the consumed resources of the Data Virtuality Server is shown:
- CPU Utilization - the percentage of CPU utilized to execute the query, i.e. the resources of the DV server required to calculate portions that can’t be pushed down;
- Memory buffers - the amount of memory that is stored in buffers - this information is not precise, as garbage collection cleans away unused resources in certain intervals, but not immediately;
- Disk buffers - the amount of memory that can not be stored in memory and needs to be spilled to disk. As SSDs are much slower than buffers, as soon as data needs to be stored in disk buffers, performance will suffer;
- Total buffers - the total number of buffers;
- Memory allocated by thread - in contrast to memory buffers that store query results, memory allocated by thread depicts the RAM usage of the process itself.
In the below example, a query was joining two disparate tables and wrote the results to a third database system:
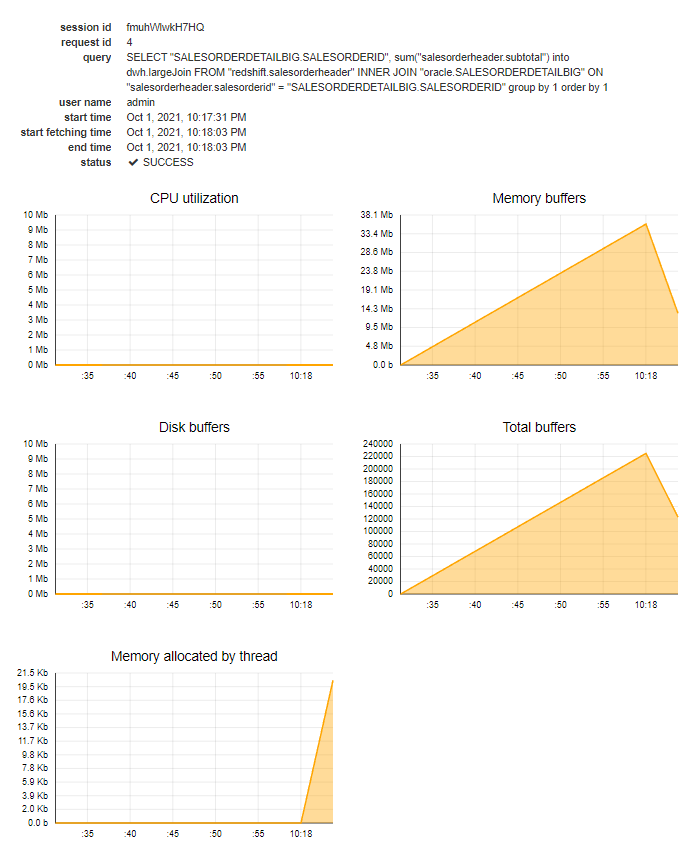
- CPU usage is very low, this is because the query could be completely pushed down, and no calculation needed to be performed in the Data Virtuality Server’s query engine;
- Memory buffer usage goes up, as results are stored in memory before writing them to the target database;
- Disk buffers are not used, as memory buffers suffice in storing intermediate results;
- The total number of buffers runs in parallel to the memory buffers, as expected;
- Almost no memory is allocated for executing the query, as all queries can be pushed down.
If long-running jobs are present on the system, the performance of identical queries may differ. One possible explanation for this is that the system was experiencing a load from jobs running simultaneously with the query. Using the job history, it is possible to identify times of the day when many jobs are running in parallel. A strategy to remove the bottleneck is to schedule jobs to run at low load times, “spreading” them evenly. The feature of dependent scheduling can be helpful here, kicking off a job when another job has been completed. To extend this further, jobs can be scheduled in cascades, so that they are running back to back and not concurrently.
For more detailed documentation on the performance monitoring tool, please see Performance Monitoring.