Skip table of contents

Web Application

The Performance Monitoring web application is already deployed to your server and requires no setup. You can use it to both monitor resources and view information on queries.

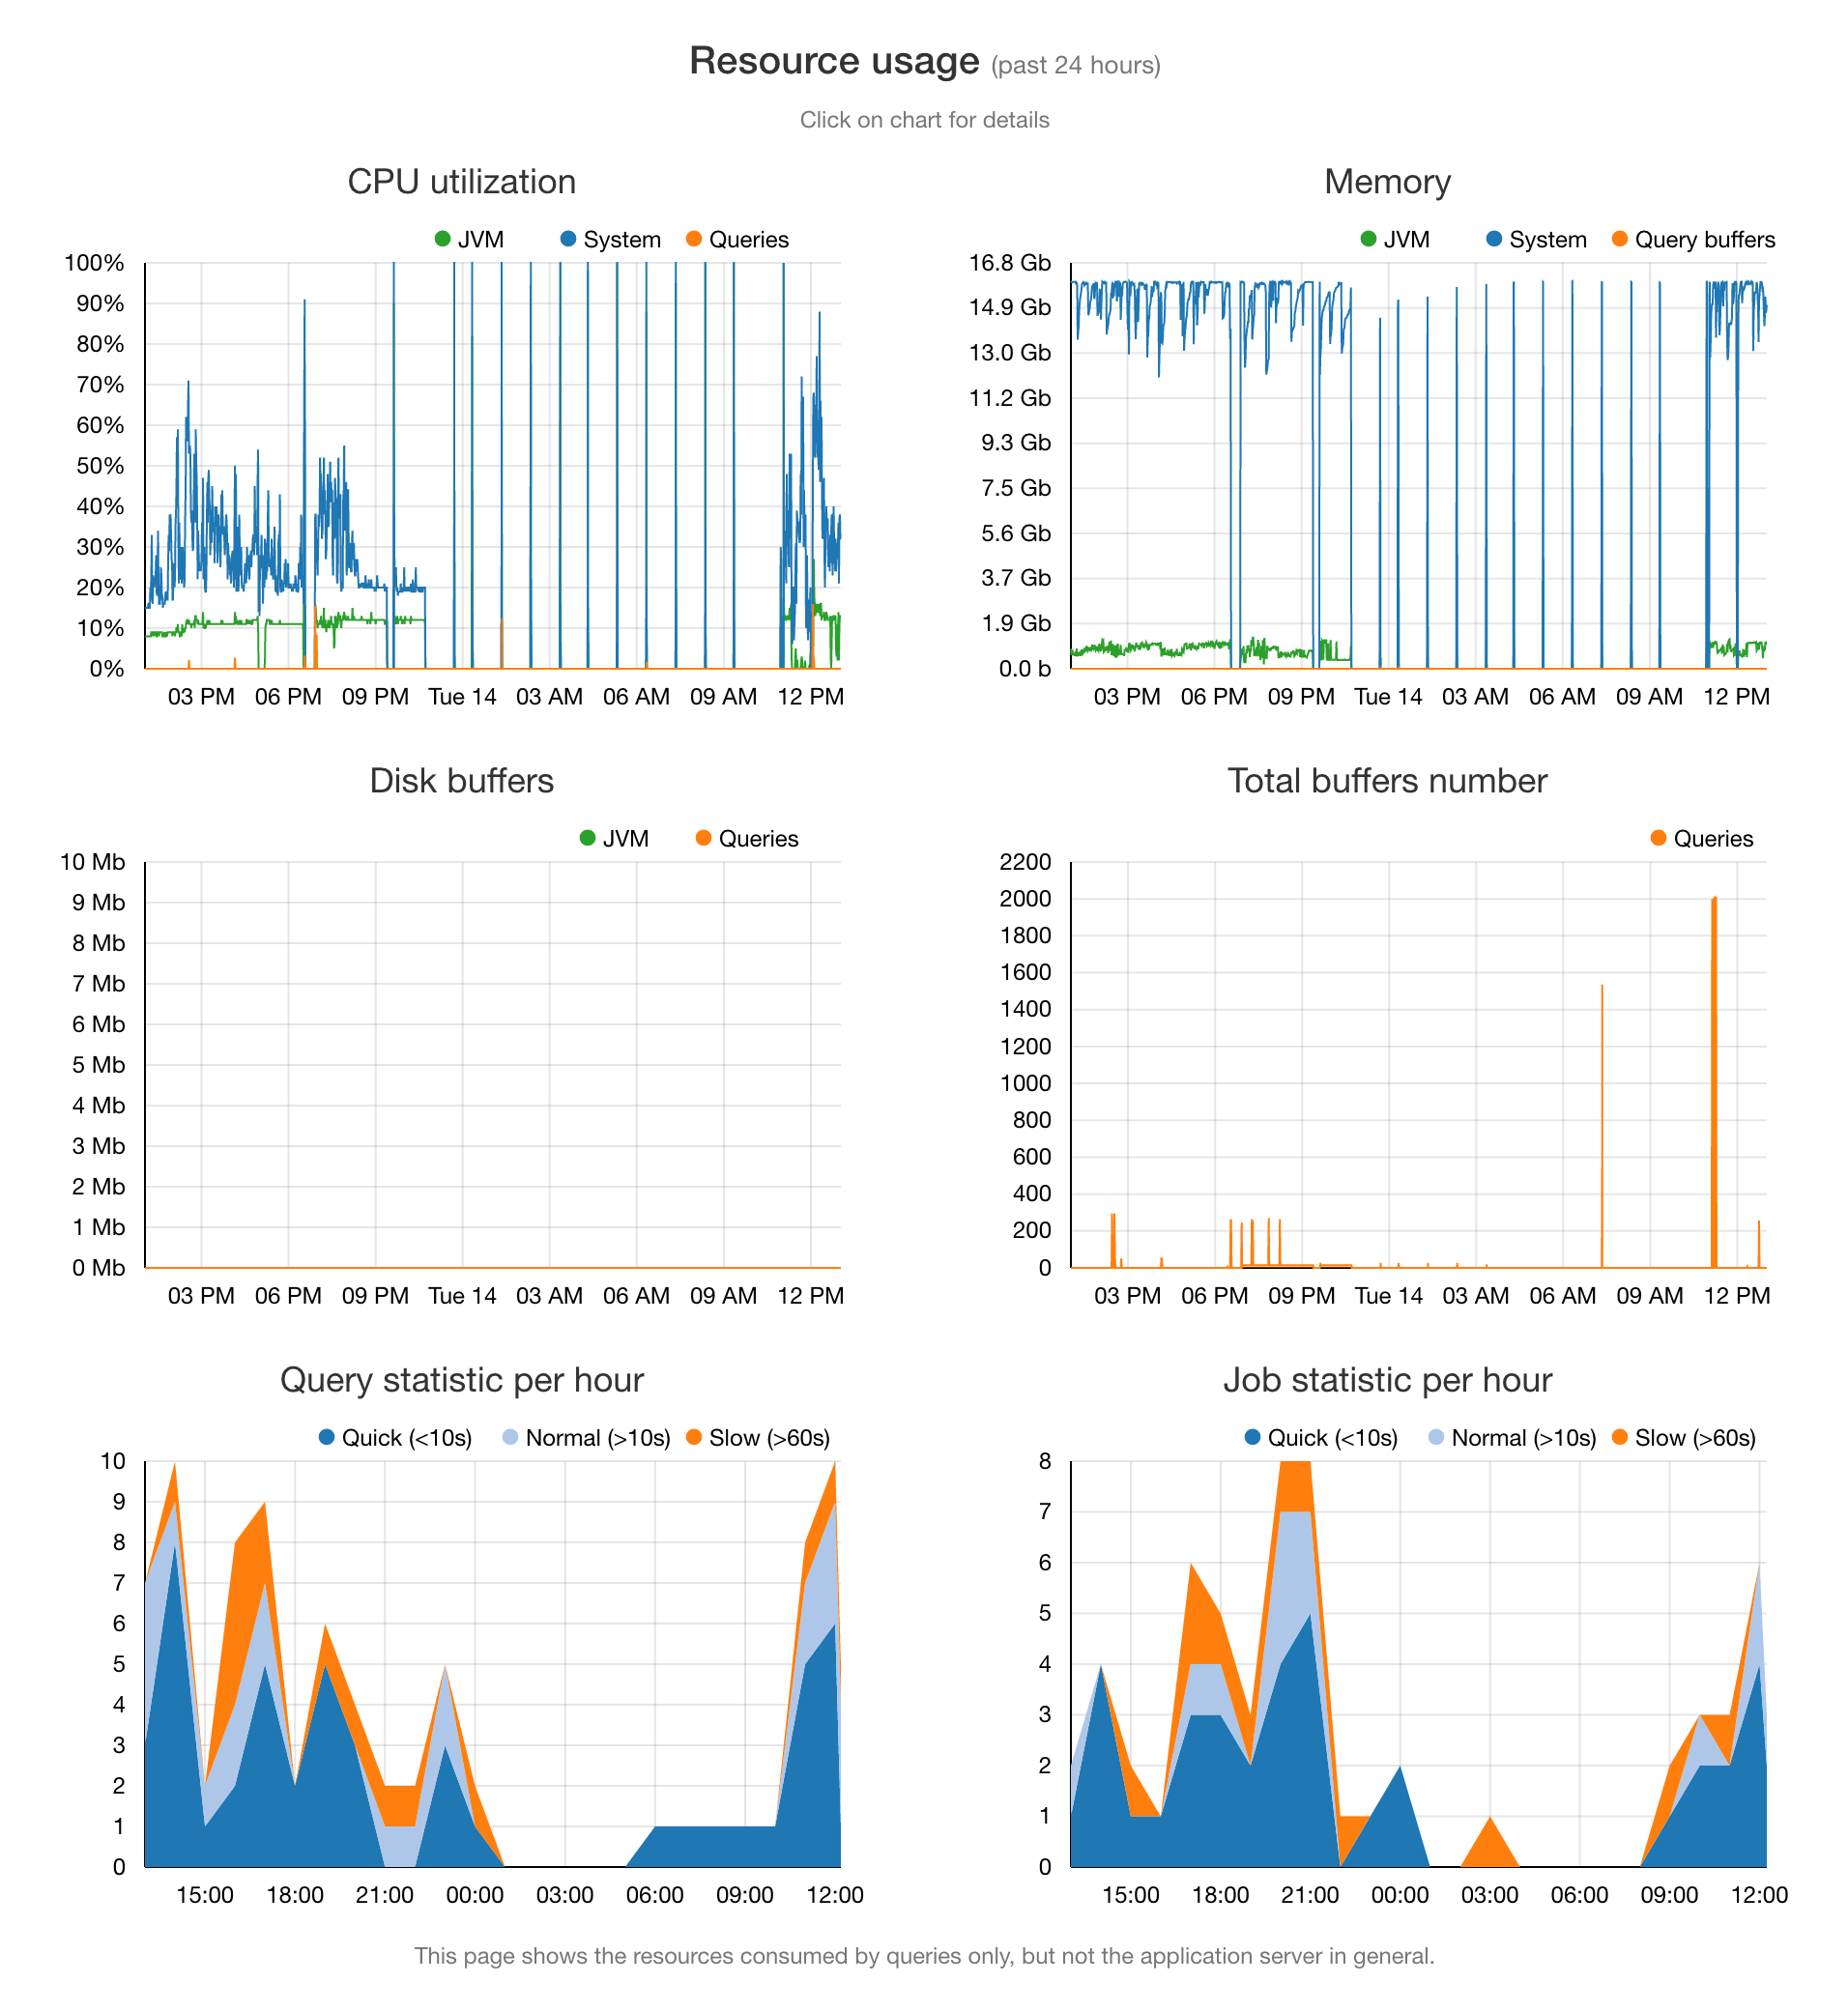
Monitoring Resources

The various resources available to the system, such as CPU, Memory, Disk buffers, etc., are displayed on the main page of the web application as charts:

Displays resource usage for the last 24 hours, including CPU, memory, disk buffers, buffer counts, and hourly query and job activity, helping identify load patterns and performance issues.

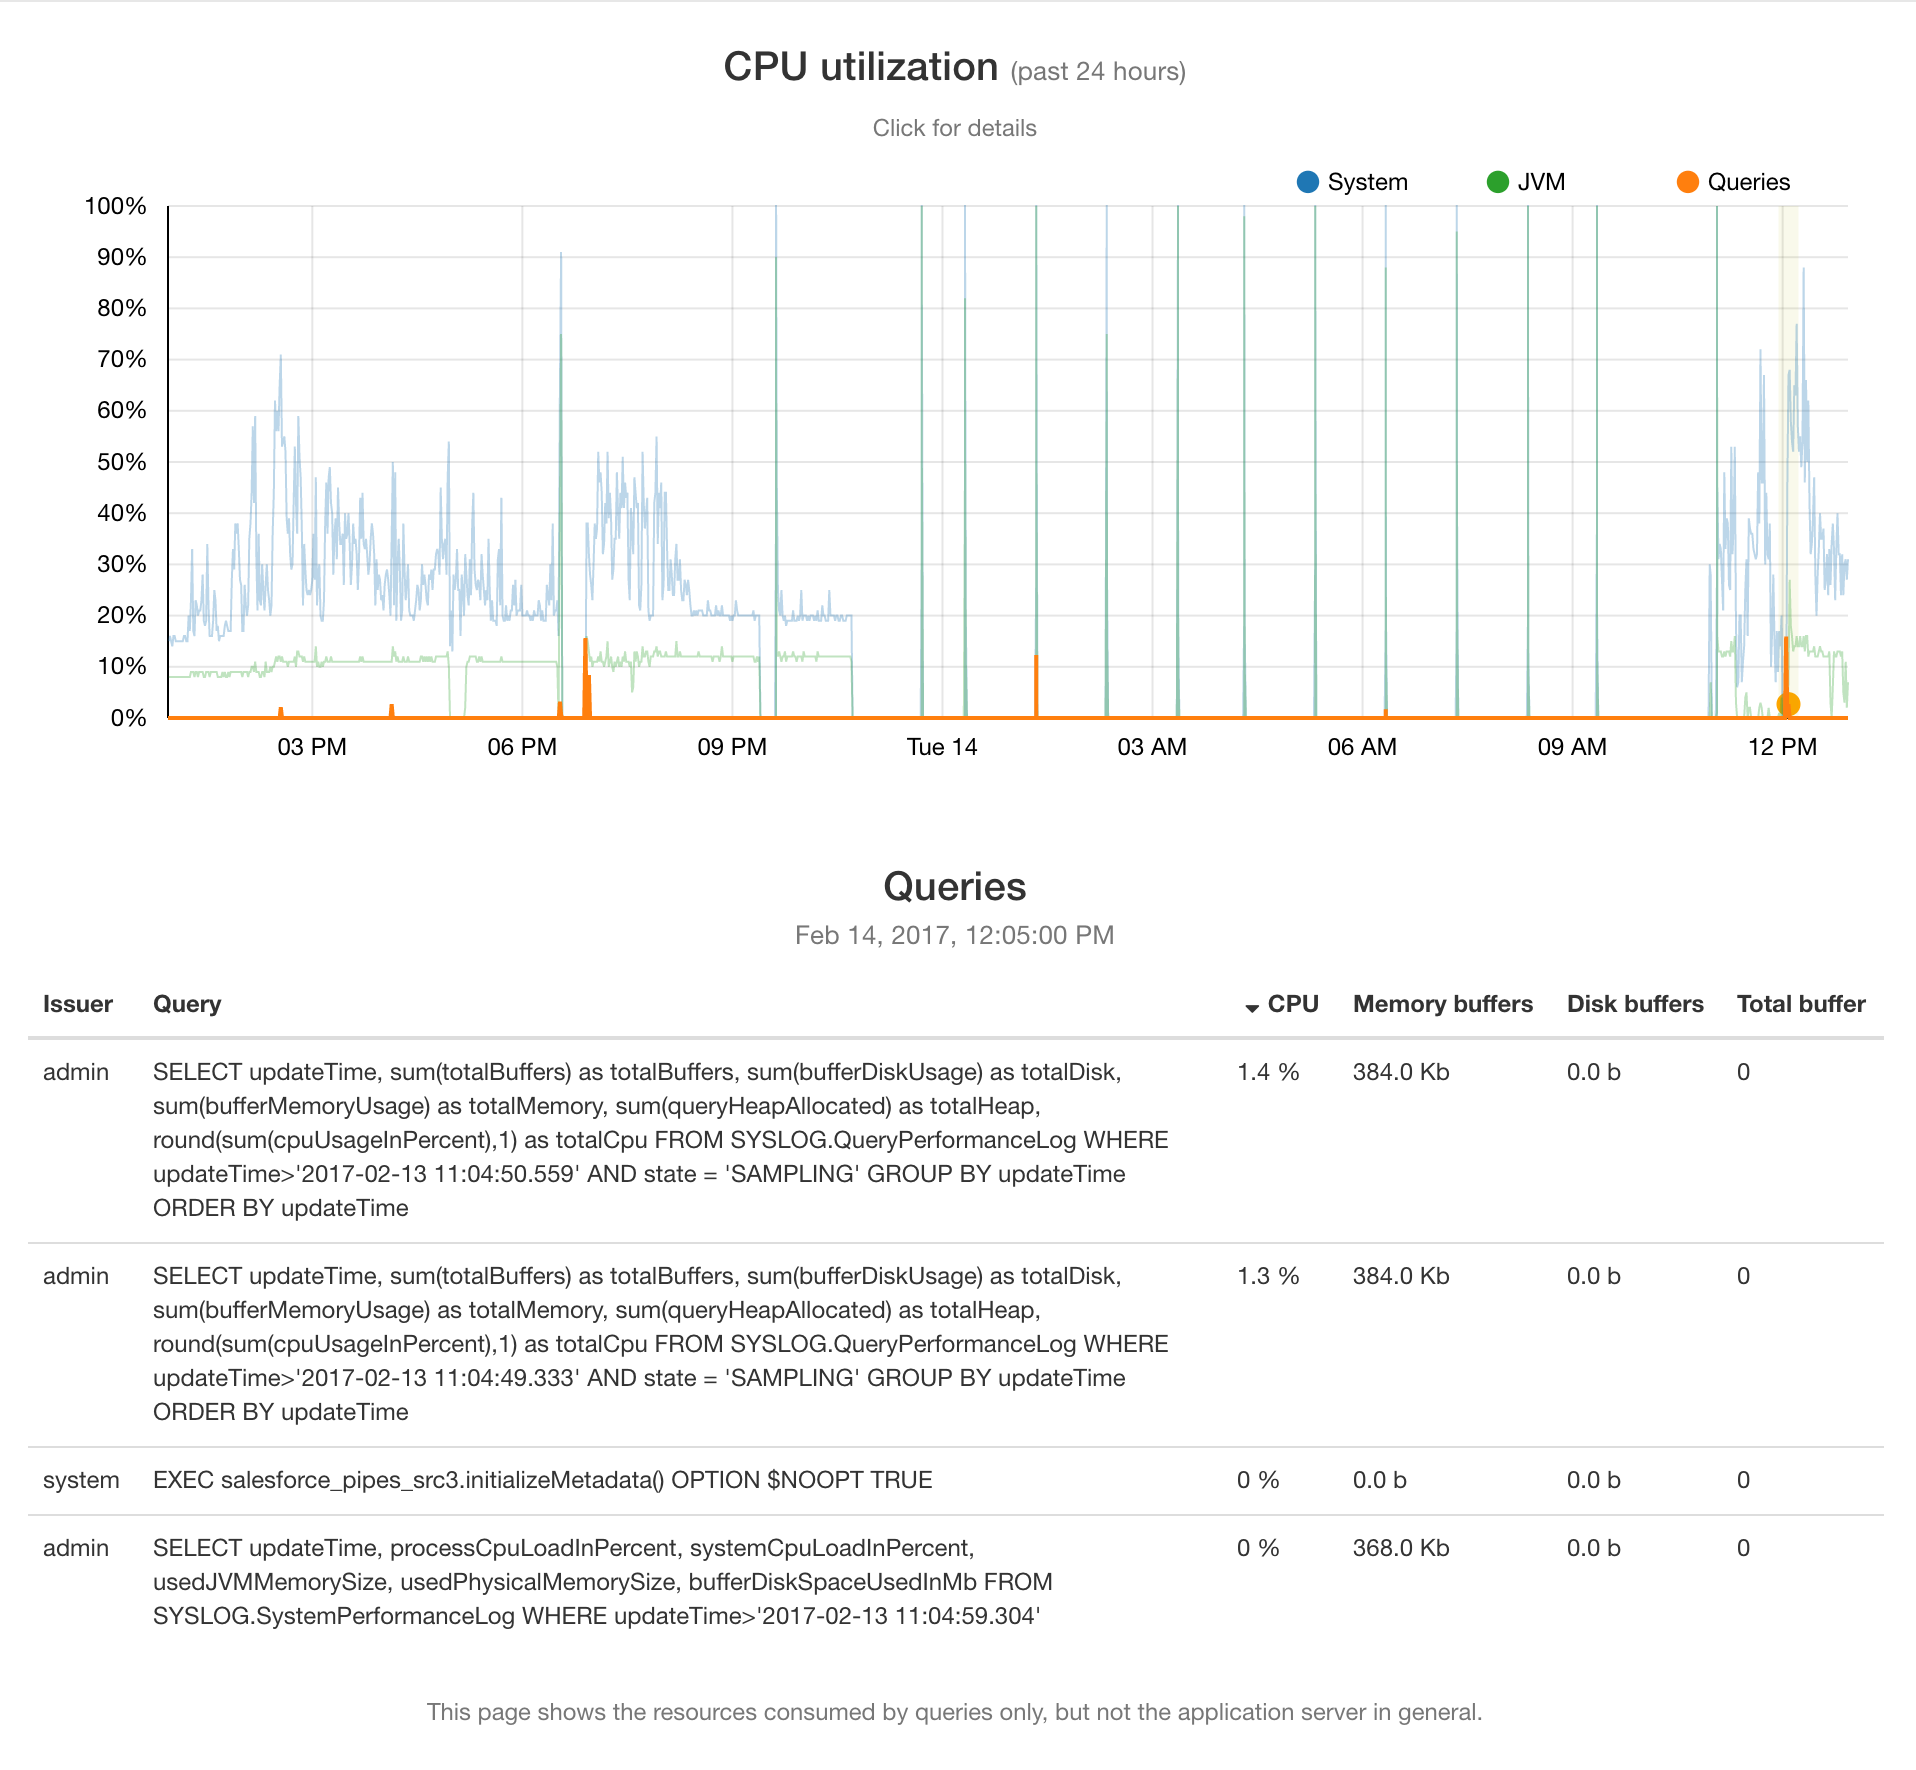
To see more information about each particular resource, click its chart, and you will be taken to an in-depth visualization:
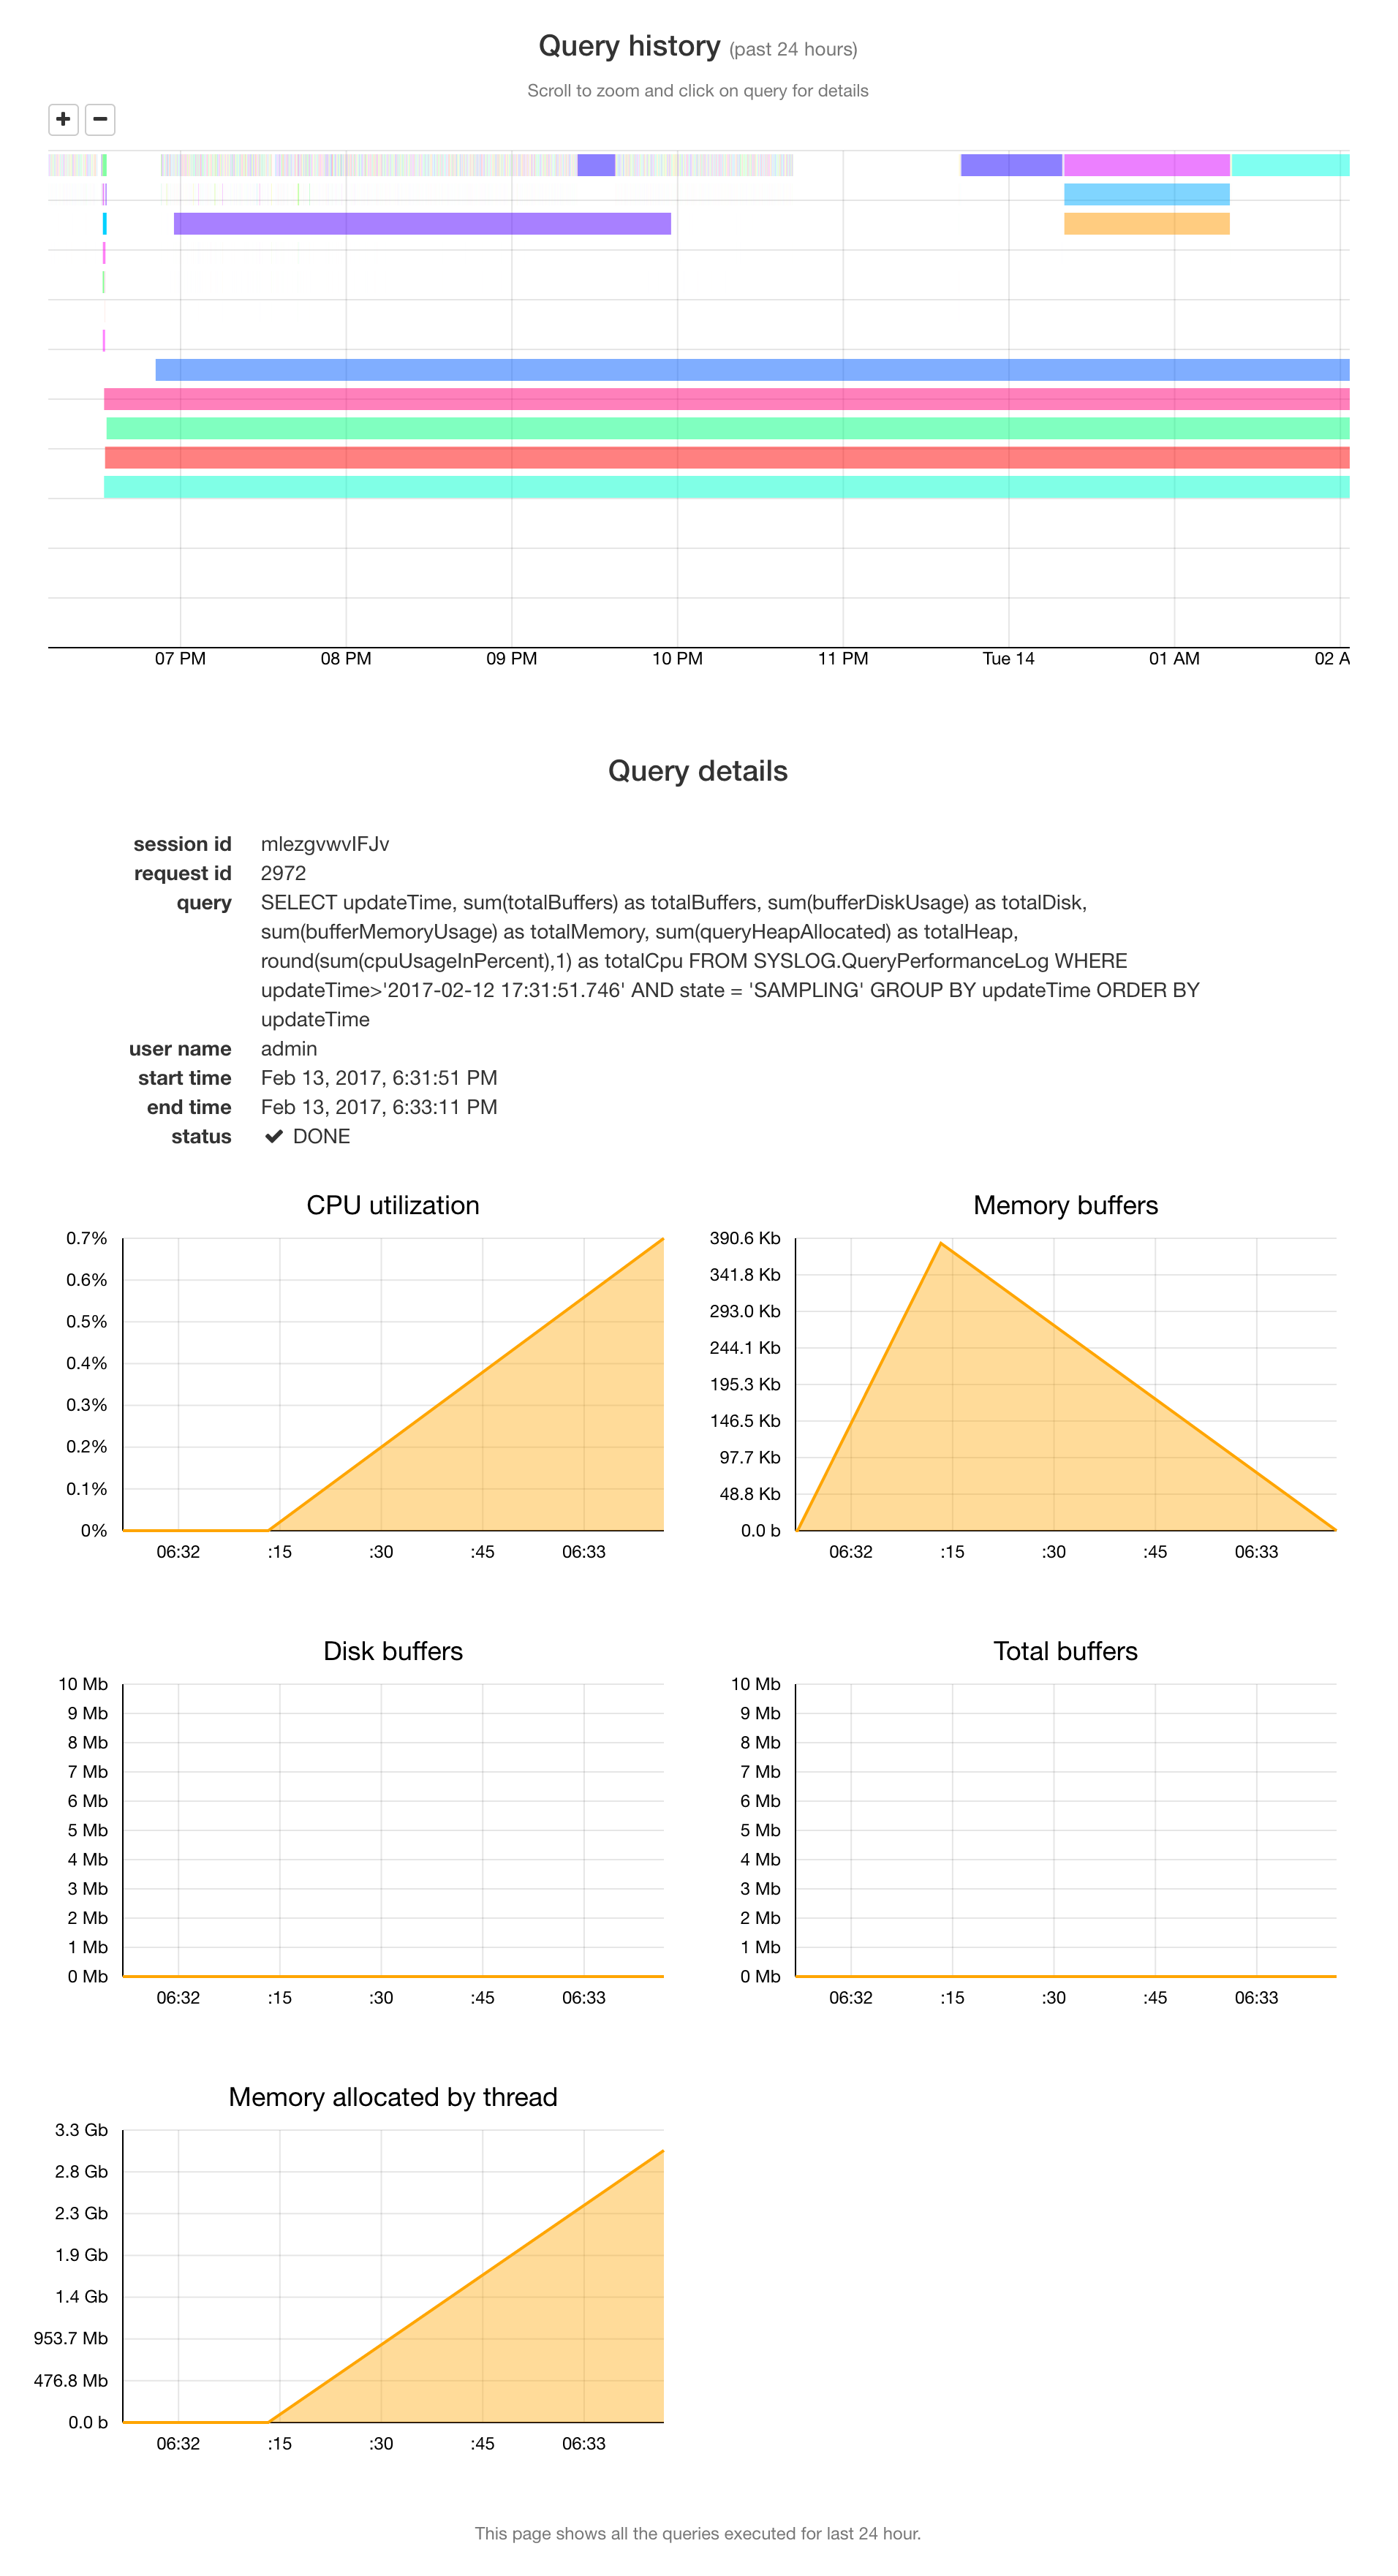
Shows queries executed in the last 24 hours with a timeline view, detailed query metadata, and per-query resource usage such as CPU, memory, and buffers to help analyze individual query performance.

Viewing Queries

The query history is displayed on a special page, and you can view detailed information about the resources consumed by any query by clicking on it. Here's how it looks:

Displays CPU usage over the last 24 hours with a timeline and a list of queries, showing per-query CPU, memory buffers, disk buffers, and total buffer usage for quick performance analysis.
JavaScript errors detected

Please note, these errors can depend on your browser setup.

If this problem persists, please contact our support.