XML JSON Query Builder
You are looking at an older version of the documentation. The latest version is found here.
Starting the Builder
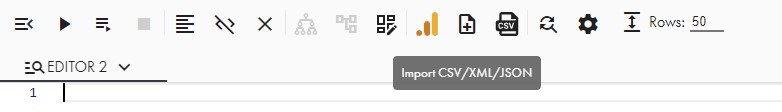
You can start the query builder from any SQL tab by clicking on the down arrow in the icon bar and selecting Open XML/JSON query builder:
Builder Elements
This is what a full query builder looks like:
The builder consists of several panes which we will describe below.
Source Pane
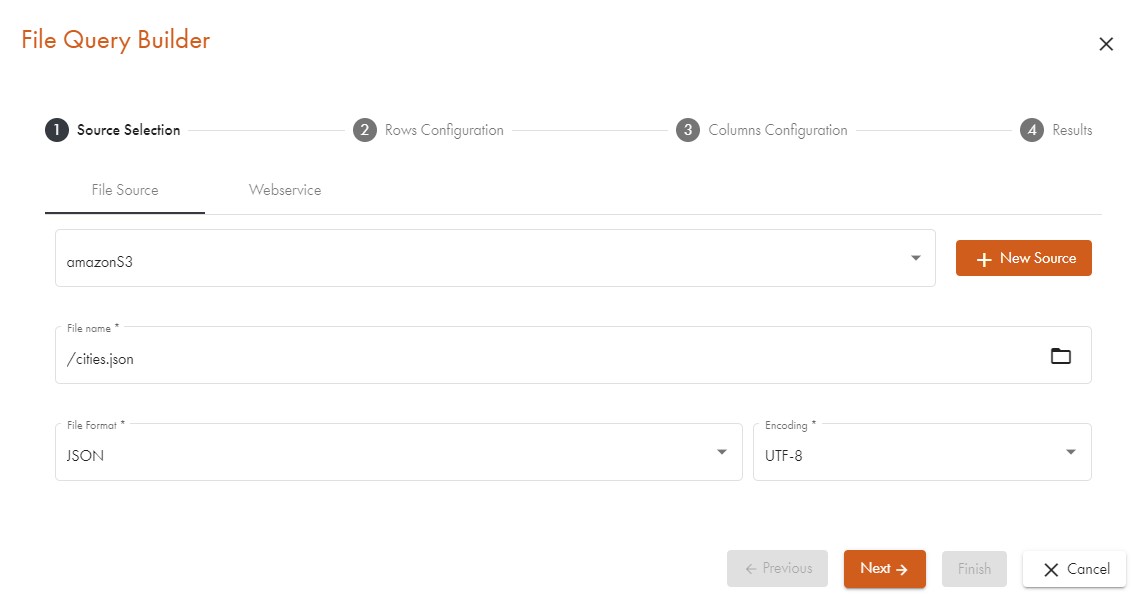
The most important part of the builder is the source pane. You have two options to choose from:
- Select the File source tab and get your data from an accessible file that lies in your file system. To use this, you must have a data source of type File connected and the appropriate right to read files in this directory.
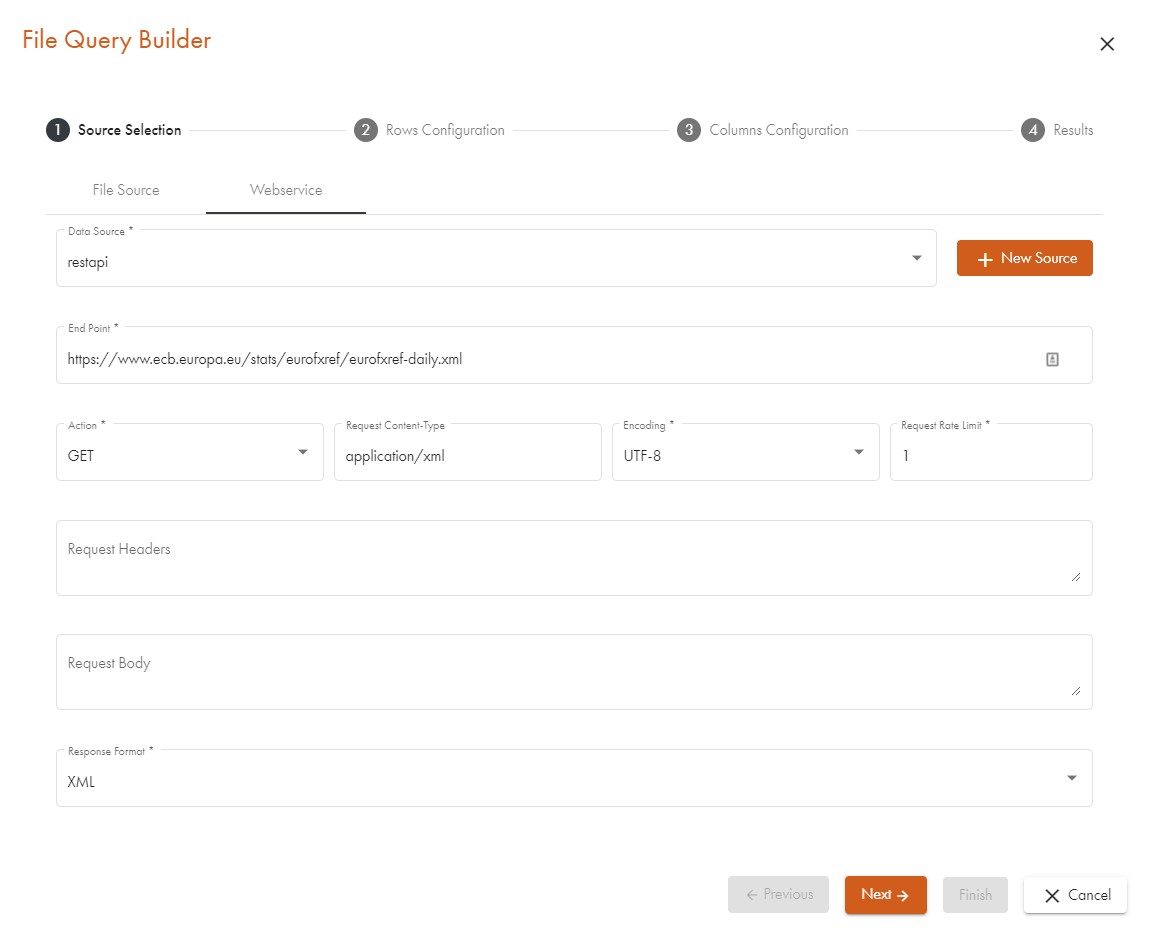
- Select the Web service tab and get your data from a REST API which allows you to retrieve data via URL and maybe some additional parameters (please refer to the section Communicating with Web Services to see how to set the parameters for Web Service access). In order to get the data, you must have a data source of type Web service.
After selecting the correct data source, click on the folder icon and select a file from the opening dialogue:
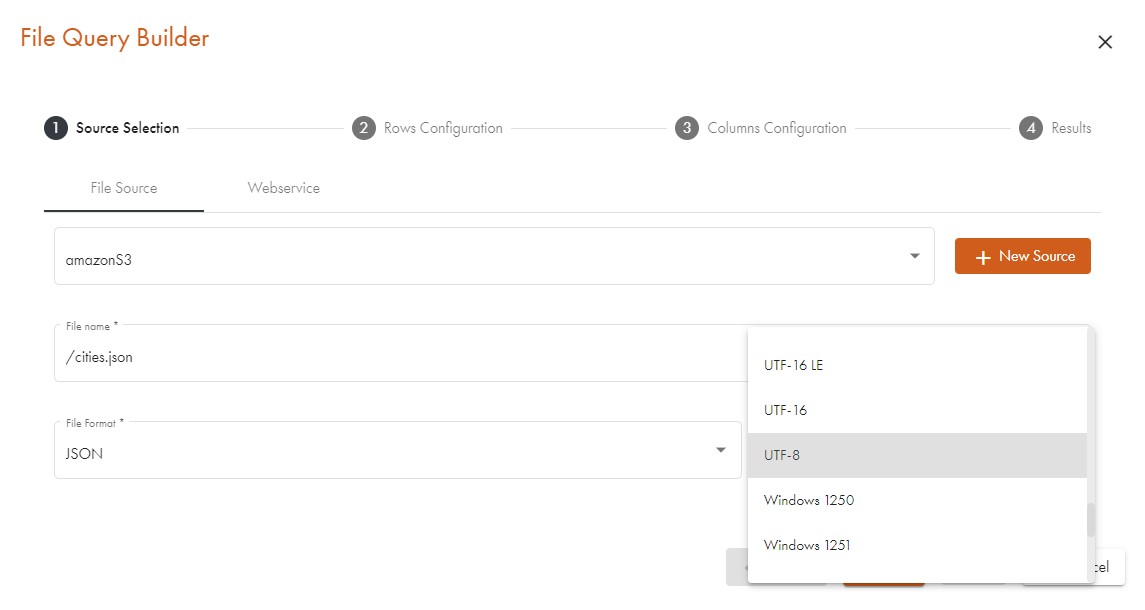
Selecting an encoding for XML (Source Pane)
The default value for the encoding field is UTF-8. If the selected XML file contains encoding information in its prologue, this encoding will be selected, the notification "The encoding is specified in XML file" will be displayed, and the encoding combobox will be disabled:
For a web service, encoding will be set when the Apply button is pressed if the XML content type is selected and the prologue contains encoding information. When you select the same XML source again, the encoding will be set immediately, the notification "The encoding will be specified in XML source" will be displayed, and the encoding combobox will be disabled.
Preview Pane
This pane contains two tabs that help you get the query builder to do as you wish. You can use the tab labelled Source data preview to check what the actual data looks like. You will see all the details as if the data were presented to you in a simple text file. No columns, just many lines of XML or JSON code. You can use this tab to see what you need to specify as a root element later.
The Raw configuration tab shows you the structure that Data Virtuality Studio automatically detected in the data in form of a tree view. This helps you to determine which (recurring) element you want to have. The right-hand side of this pane allows you, after you selected your main element, to see what elements would produce rows when the data is loaded:
Output Columns Dialogue
After the first dialogue, another one where the output columns can be specified along with their respective data types is shown:
There is a pane displaying the structure of the type of element that we have selected (top left) and it can be used in an easy way to define which attributes or sub-elements we want to display in the output. We can fiddle with the data types of the output columns in the column pane (top right) and we get a data preview of the resulting table in the preview pane (bottom).
Using the Query Builder to Import XML Data (Same Works with JSON)
Getting the Raw Data (Source Pane)
The first step is to get the raw data from your source. For the sake of brevity, this guide is based on a web service data source that delivers XML content and we omit the file data source. If you want to retrieve data from a web service, you might want to read the section Communicating with Web Services first. In the sample case, we have a very simple REST API that can be accessed via URL.
The API produces weather data and we will use the URL https://academy.datavirtuality.com/wp-content/uploads/2022/06/forecast.xml to get the XML content. We can easily test the URL by simply copying the string into a browser's address line and pressing enter. XML data will show up.
Remember that for file data, you need a valid file data source and for web service data, a web service data source is required. The generic_ws data source can be entirely empty apart from an alias.
We start the query builder, as described earlier, from any open SQL editor tab by clicking on the icon showing a down arrow and then selecting Open XML/JSON query builder from the menu. For this guide, we have created a dummy data source called generic_ws which we use to request the data:
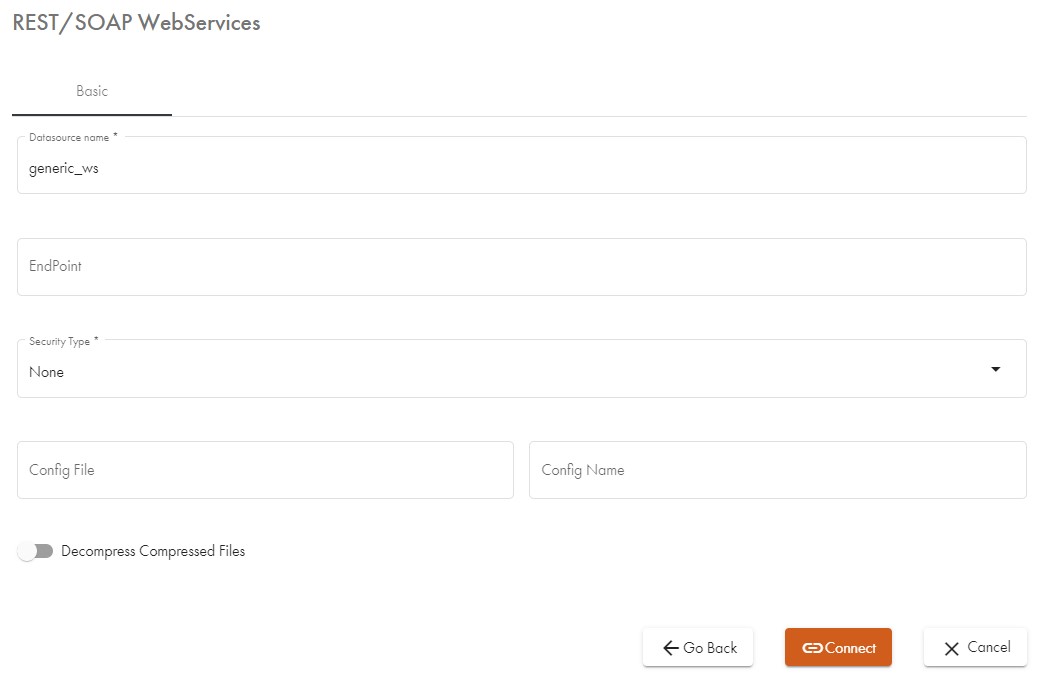
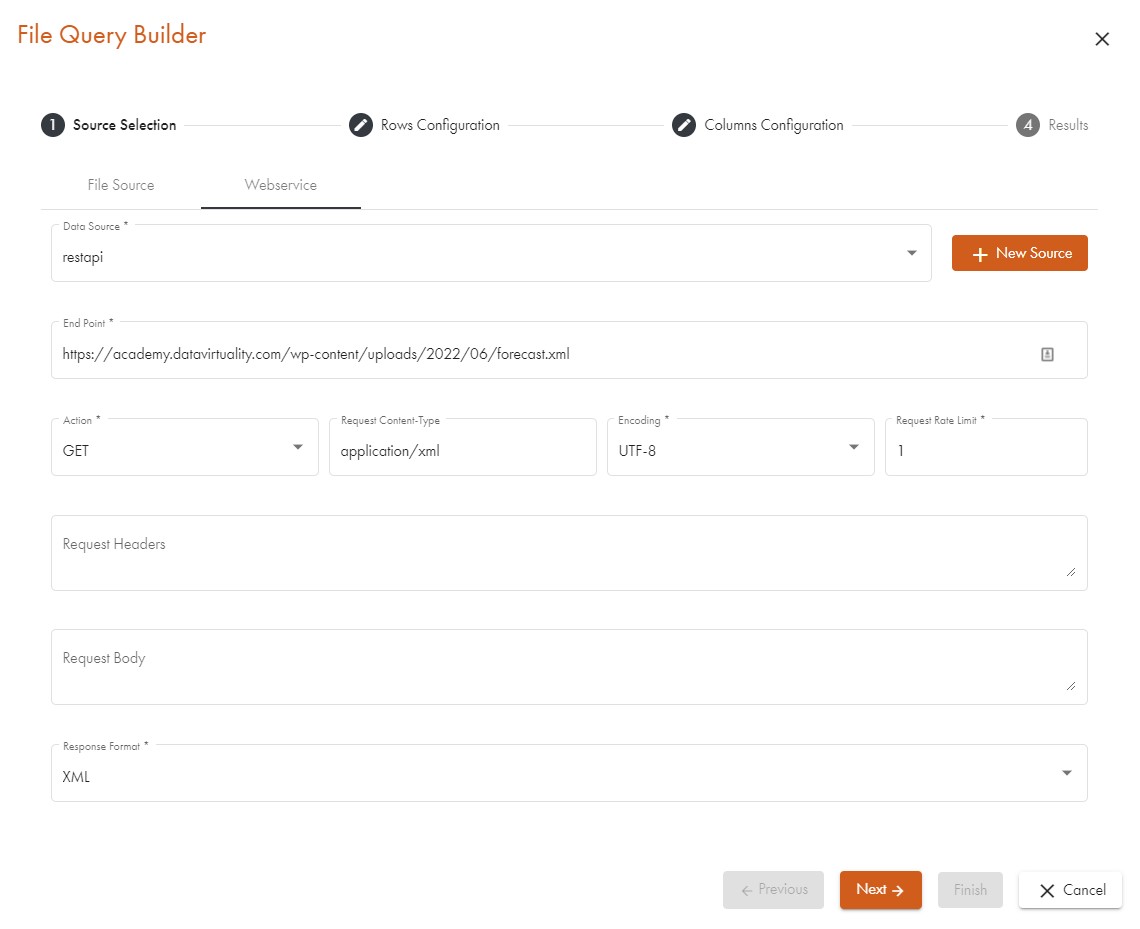
We select the tab labelled Web service in the source pane and enter the following information:
- Data source: generic_ws from a drop-down menu
- Endpoint: https://academy.datavirtuality.com/wp-content/uploads/2022/06/forecast.xml
- Request content:
application/XMLfrom the drop-down menu - Response format:
XMLfrom the drop-down menu - Encoding:
UTF-8
If we had an endpoint that yields JSON data, we would change the following setting:
- Request content:
application/JSONfrom the drop-down menu - Response format:
JSONfrom the drop-down menu
Please note that no matter how you get the desired data, you always have to specify an encoding; the most frequently used ones are UTF-8 and windows-1252.
After all is correctly set, we click on apply and the data is loaded in the background.
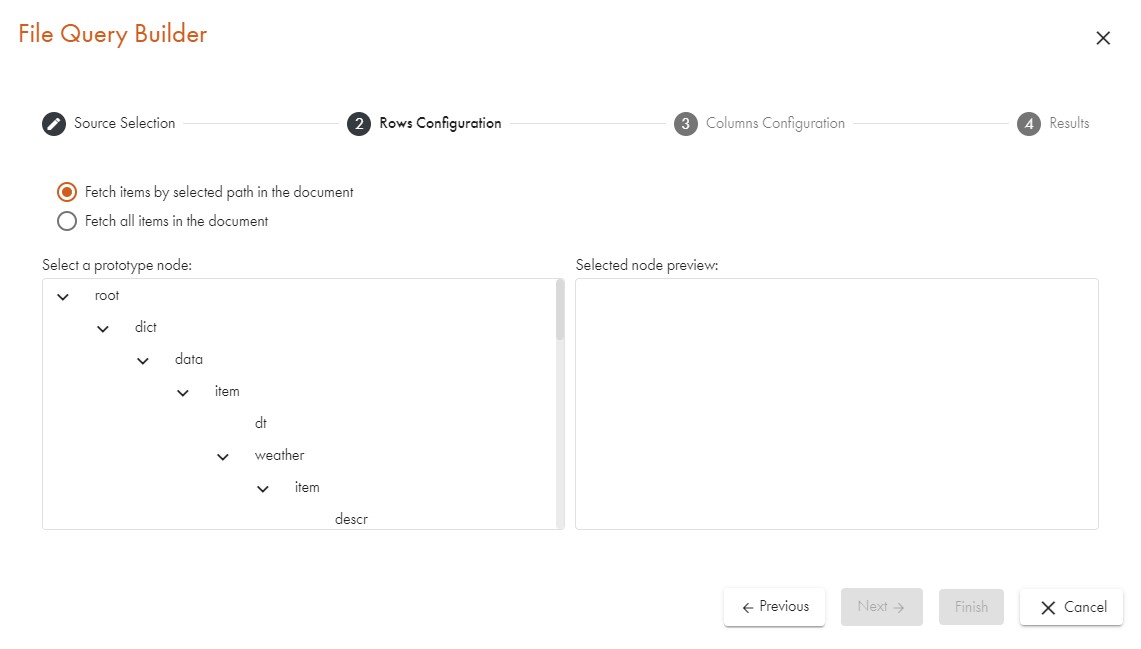
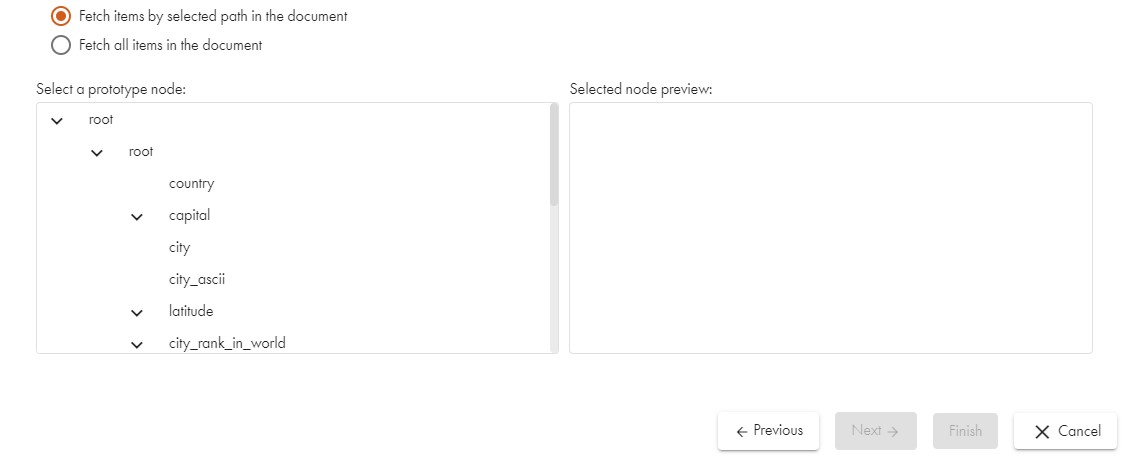
Selecting the Main Element (Preview Pane)
In the next step, we select the type of element node that will be the basis for the rows. The system checks the whole structure for each recurring element of the type that we select. These will automatically be mapped to rows. If we are not entirely sure, we can select the Source data preview tab in the preview pane and try to figure out which elements we are interested in. In case we already know them, we can skip this part. Below is a part of what the preview can look like.
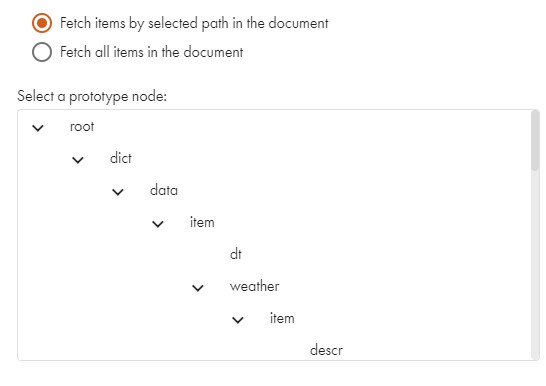
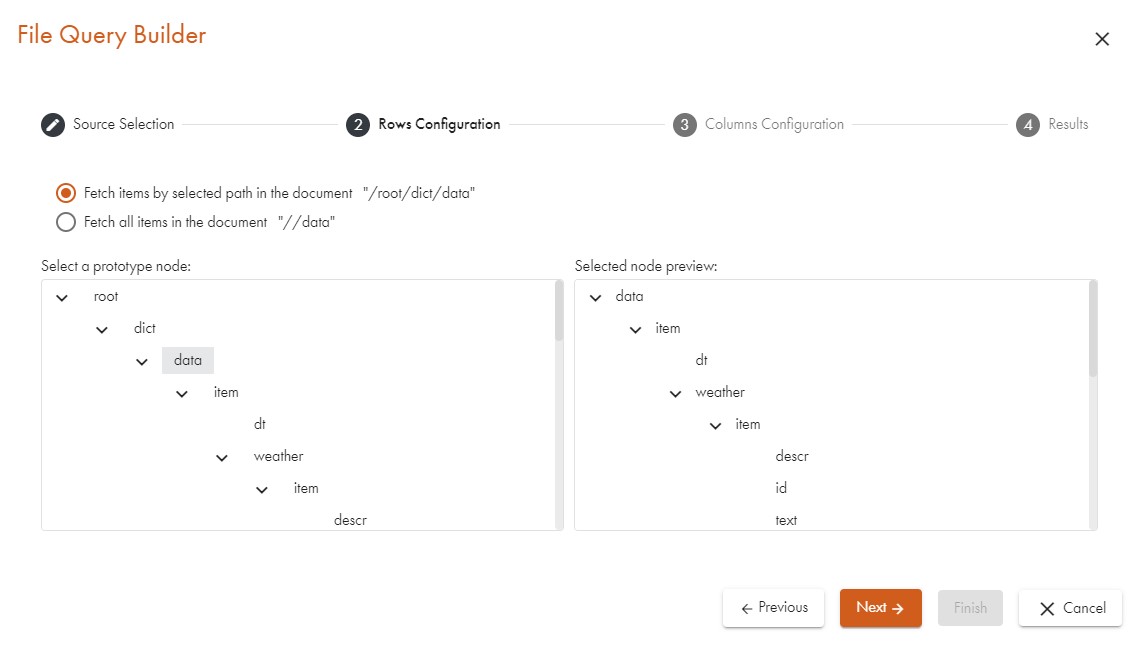
Now we select the major element that we want. The screenshot below demonstrates the detected structure of the XML data and the tree is collapsed to make it obvious what is the core of the data. Surely, we want to get one row for each day that we have a forecast for. In order to do this, the easiest way is to double-click on one of the time sub-elements:
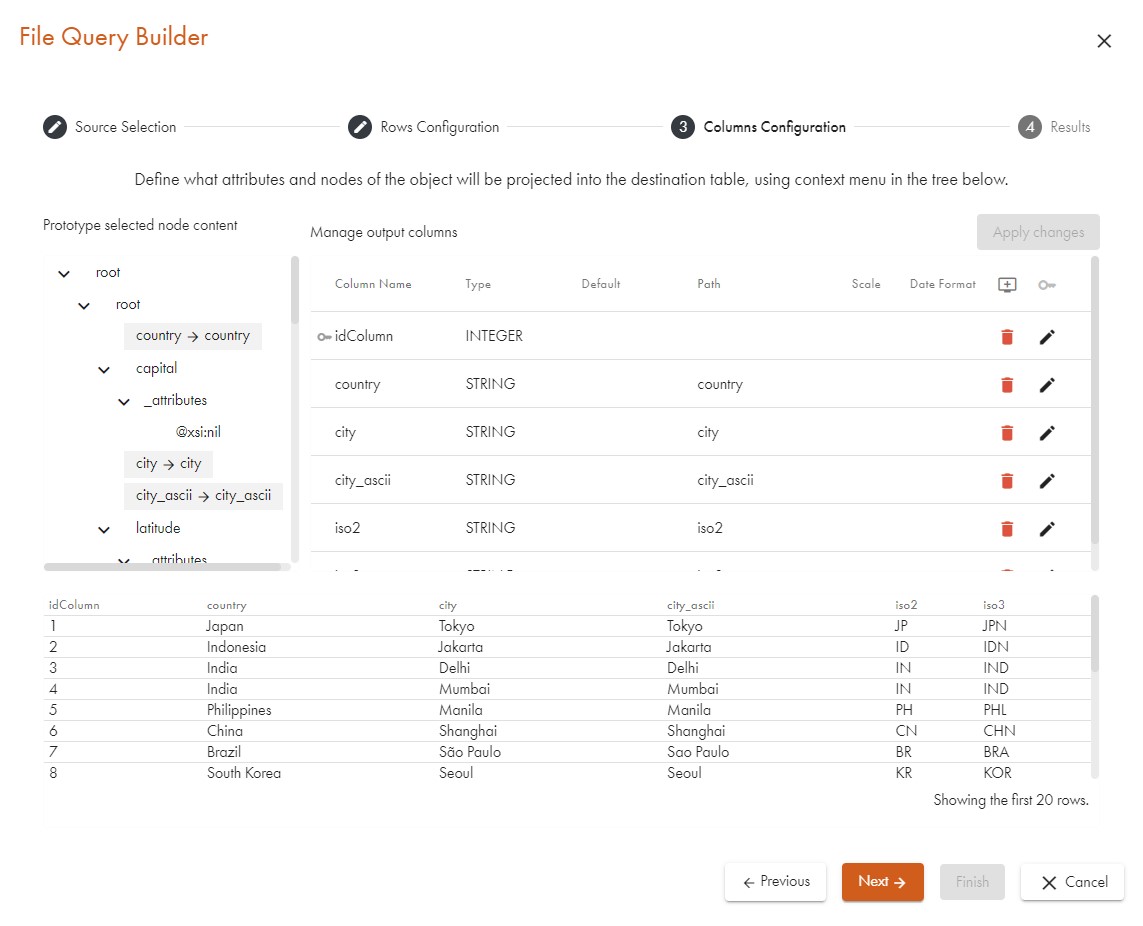
Selecting Output Columns
Having verified that the correct elements are selected, we click on Next and proceed to the dialogue which lets us choose the desired output columns. We browse through the structure of the XML element that we have opted for and which is displayed in the prototype pane. All sub-elements, their values, and all their attributes are shown. Double-clicking on an entry will add it to the output columns and the column pane will change accordingly. After each selection (or deletion, if you remove one of the columns), the preview pane at the bottom of the dialogue will change. Here is a sample after we have manually added the day attribute from the time element and the temperature sub-element. The idColumn is automatically generated and does not have to be used. We can reorder, add, or delete output columns with the buttons above the output column pane:
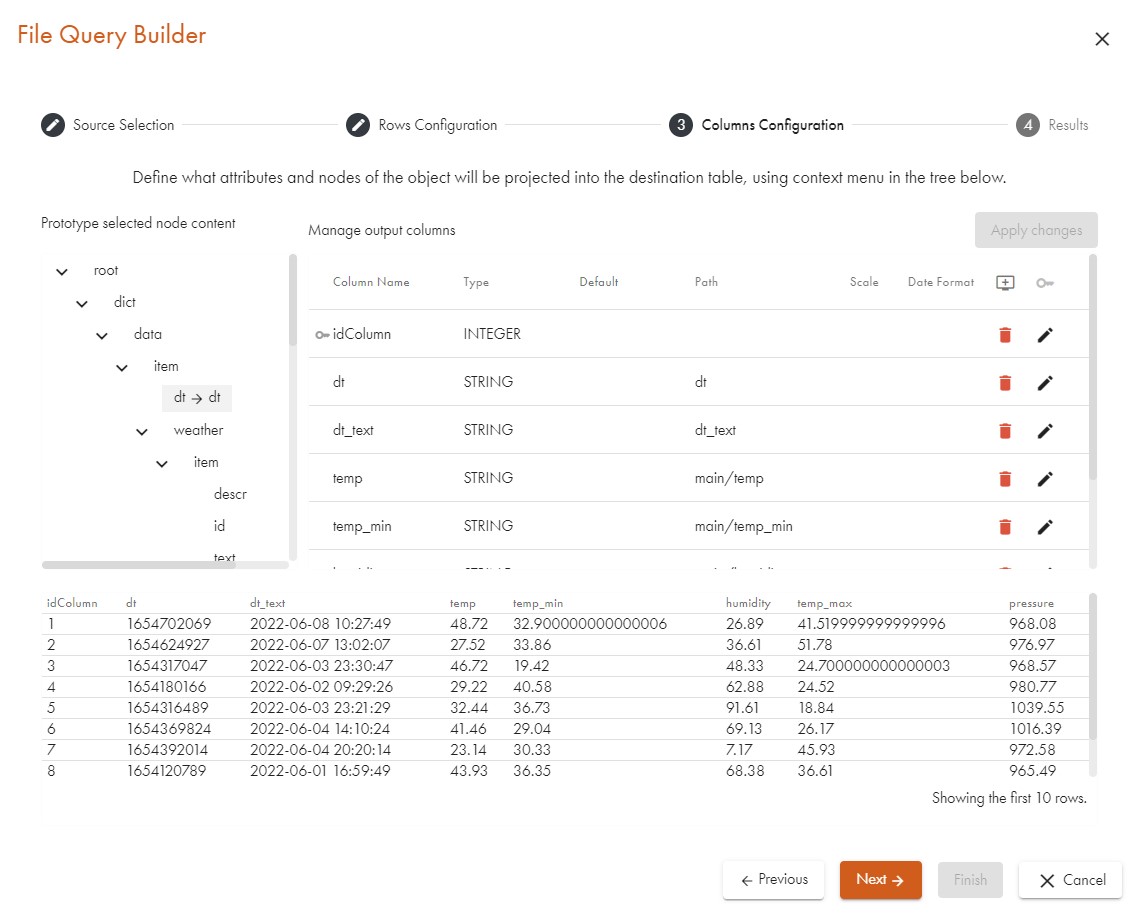
Adjusting the Output Columns
As the Data Virtuality Studio automatically names the columns according to the name of their element or attribute name, we have two columns called id and id_1 which are not very informative. We can rename them by clicking the cell with their name in the column pane and renaming them to what they represent: id and city_id . Every change in the columns pane will trigger a refresh in the preview pane.
We can also change the data type of a column by clicking the cell of the Type column and the row that specifies our output column.
Be very careful when selecting the data types. If a single data record cannot be cast to the type that was set, the whole import will fail. The most reliable option is STRING.
After renaming the columns and changing their data types, the dialogue is finished and looks as follows:
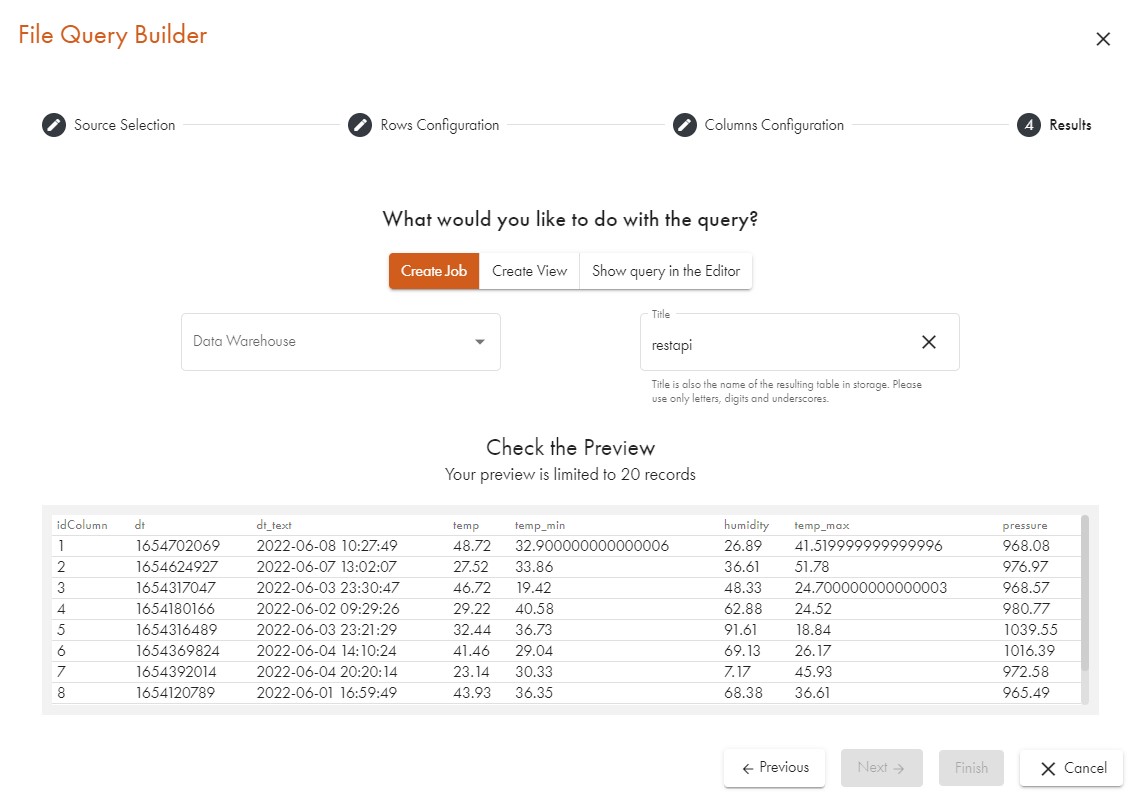
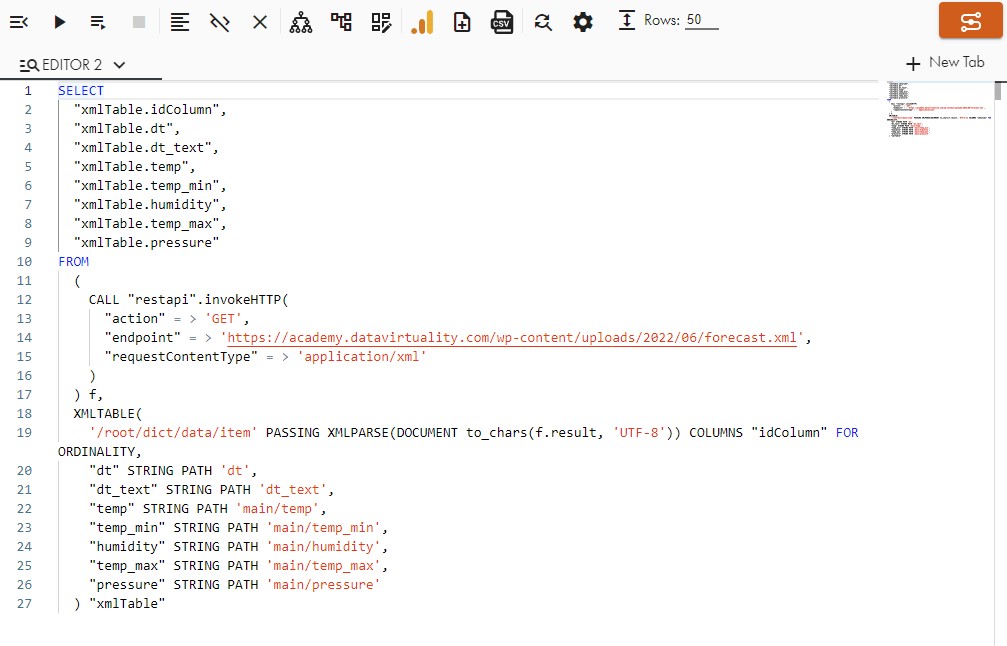
All is good, so we click OK to confirm that we now want the code for the XML import generated. The Data Virtuality Studio will show the following code:
SELECT
"xmlTable.idColumn",
"xmlTable.dt",
"xmlTable.dt_text",
"xmlTable.temp",
"xmlTable.temp_min",
"xmlTable.temp_max",
"xmlTable.pressure",
"xmlTable.humidity",
"xmlTable.id",
"xmlTable.text",
"xmlTable.descr",
"xmlTable.all",
"xmlTable.speed",
"xmlTable.deg",
"xmlTable.id_city",
"xmlTable.city_name",
"xmlTable.city_canonical_name",
"xmlTable.region",
"xmlTable.lat",
"xmlTable.lon"
FROM
"generic_ws".invokeHTTP(
endpoint => 'https://academy.datavirtuality.com/wp-content/uploads/2022/06/forecast.xml',
action => 'GET',
requestContentType => 'application/xml'
) w,
XMLTABLE('/root/dict/data/item' PASSING XMLPARSE(DOCUMENT to_chars(w.result,'UTF-8')  WELLFORMED)
	COLUMNS
	"idColumn" FOR ORDINALITY,
	"dt" INTEGER  PATH 'dt',
	"dt_text" STRING  PATH 'dt_text',
	"temp" DOUBLE  PATH 'main/temp',
	"temp_min" DOUBLE  PATH 'main/temp_min',
	"temp_max" DOUBLE  PATH 'main/temp_max',
	"pressure" DOUBLE  PATH 'main/pressure',
	"humidity" DOUBLE  PATH 'main/humidity',
	"id" INTEGER  PATH 'weather/item/id',
	"text" STRING  PATH 'weather/item/text',
	"descr" STRING  PATH 'weather/item/descr',
	"all" STRING  PATH 'clouds/all',
	"speed" DOUBLE  PATH 'wind/speed',
	"deg" DOUBLE  PATH 'wind/deg',
	"id_city" INTEGER  PATH '../../city/id',
	"city_name" STRING  PATH '../../city/city_name',
	"city_canonical_name" STRING  PATH '../../city/city_canonical_name',
	"region" STRING  PATH '../../city/region',
	"lat" DOUBLE  PATH '../../city/coord/lat',
	"lon" DOUBLE  PATH '../../city/coord/lon'
) "xmlTable"
Now we can omit unwanted columns from the SELECT clause or apply built-in functions on them. Alternatively, the statement can be used right away: