
Dashboard
The Dashboard is conveniently located on your Pipes main page. It provides easy access to your Pipes information, settings, documentation, and a point of contact with our support team in case you need help.
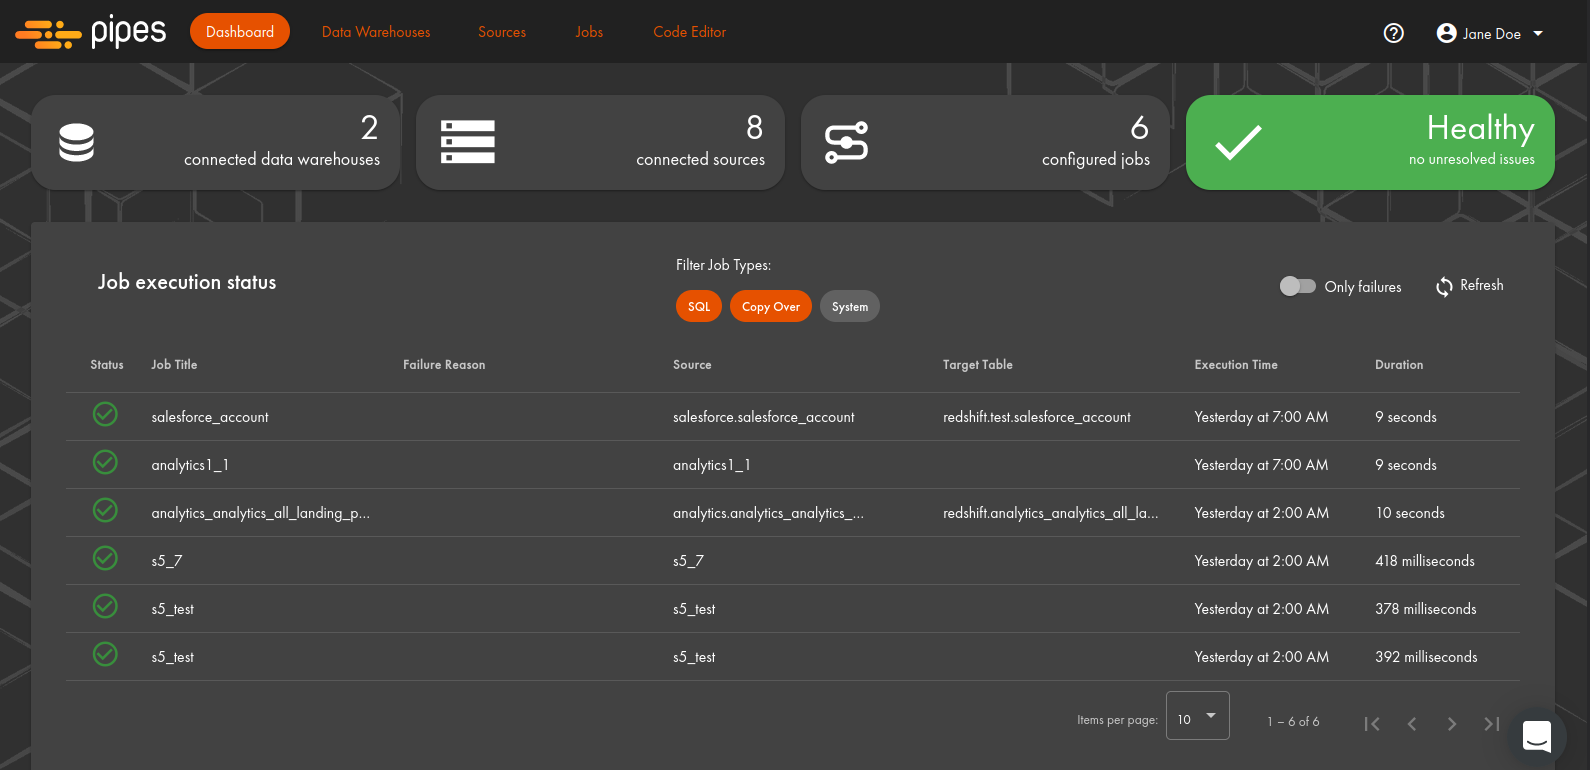
Once set up, Pipes normally does not require maintenance, but you can always check out the Dashboard to see what's going on with your Pipes installation. Here's how the Dashboard looks once you have set up your Pipes installation:
And here is what the buttons mean:
| Button | Description |
|---|---|
| Connected data warehouse(s) | Name of the data warehouse(s) used as a destination |
| Connected sources | Number of sources linked |
| Configured jobs | Number of jobs configured, may be different from the number of sources (as there can be several jobs connected to a single source) |
Healthy/Issues in the past 24 hours | This box shows if there were any failed runs in the past 24 hours. If the box is green and reads "Healthy", it means all is well. If there were any failed runs in the past 24 hours, it will become red and display the number of encountered issues. If you click on it, the log below will only show the problematic runs |
All runs for the past 24 hours are recorded in the log below. The default number of items per page is 10, but it can be changed to 50 or 100. For easy troubleshooting, you can select Only failures to view only the runs that failed (if there are any). If a run has failed, the table will also include the reason for the failure.
By default, the entries are organized from the most recent to the earliest, but you can sort them in any order you need. Every entry includes the following information: status (successful or failed), pipe title, failure reason (if the run has failed; if the run has been successful, nothing would be displayed in this column), source (the procedure employed by this pipe), target table, execution time (the time indicated is the client time), and duration.
If you need to view detailed information on any of the runs, including the time of the subsequent execution according to the schedule set up for this job, click on the relevant row in the table.
You do not have to check the Dashboard now and again to see how things are going: you can set up notifications and get a message if something requires your attention (please see the dedicated section for more information on notifications and how to set them up).