
Code Editor
The Code Editor enables you to run queries, schedule scripts, view query history, import files, export CSVs, and so on:
Code Editor Menu
The panel on the left gives quick access to information on your instance and useful information: Browser, Samples, Functions, and Metadata. If you want, you can close it by clicking the Collapse (<) button, and if you want it back, click the same button, now called Expand (>).
Browser
The Browser tab provides information on your instance: connected data warehouse(s), virtual schemas, data sources, and system schemas.
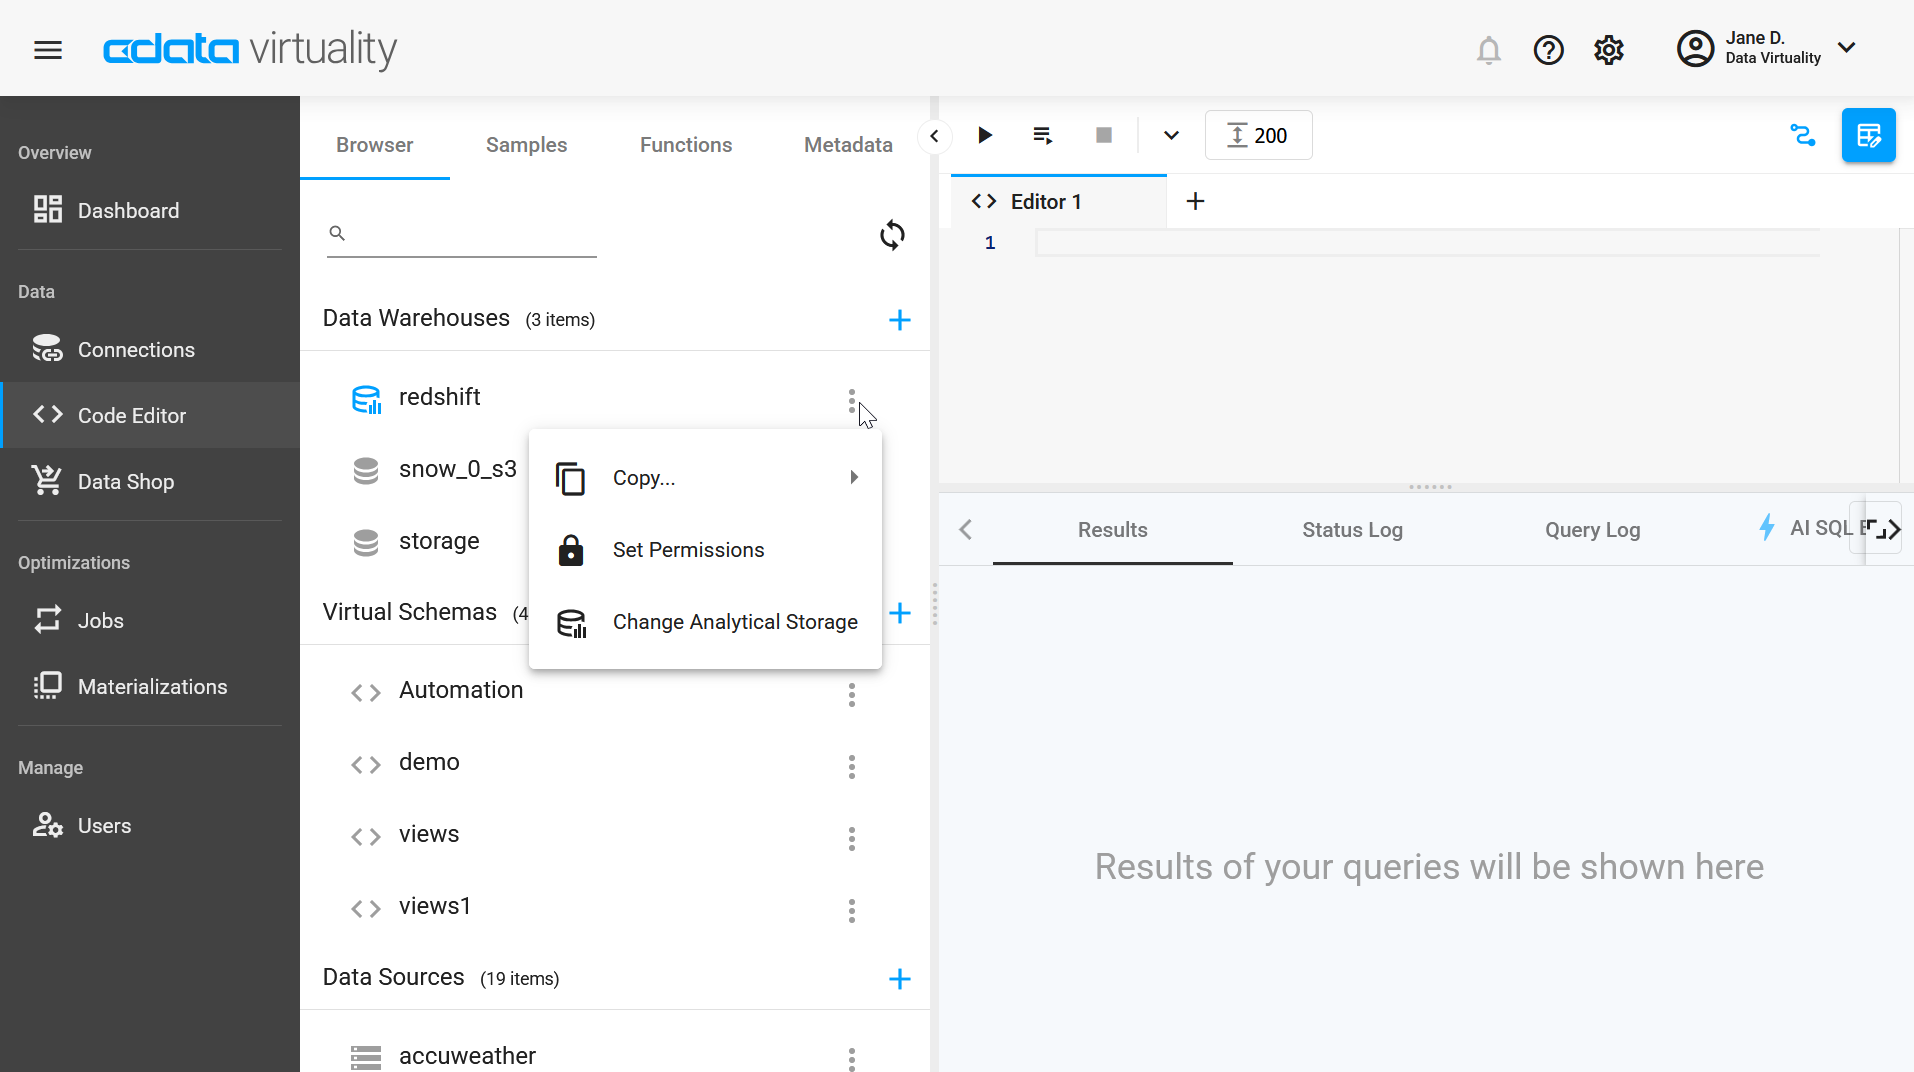
The three dots icon opens a menu with available actions. For example, if you click on the three dots icon for Redshift (our chosen Analytical storage in this example), you will see the options to set permissions for it or change the default analytical storage:
If you click on the Analytical storage name, you will see the list of its elements:
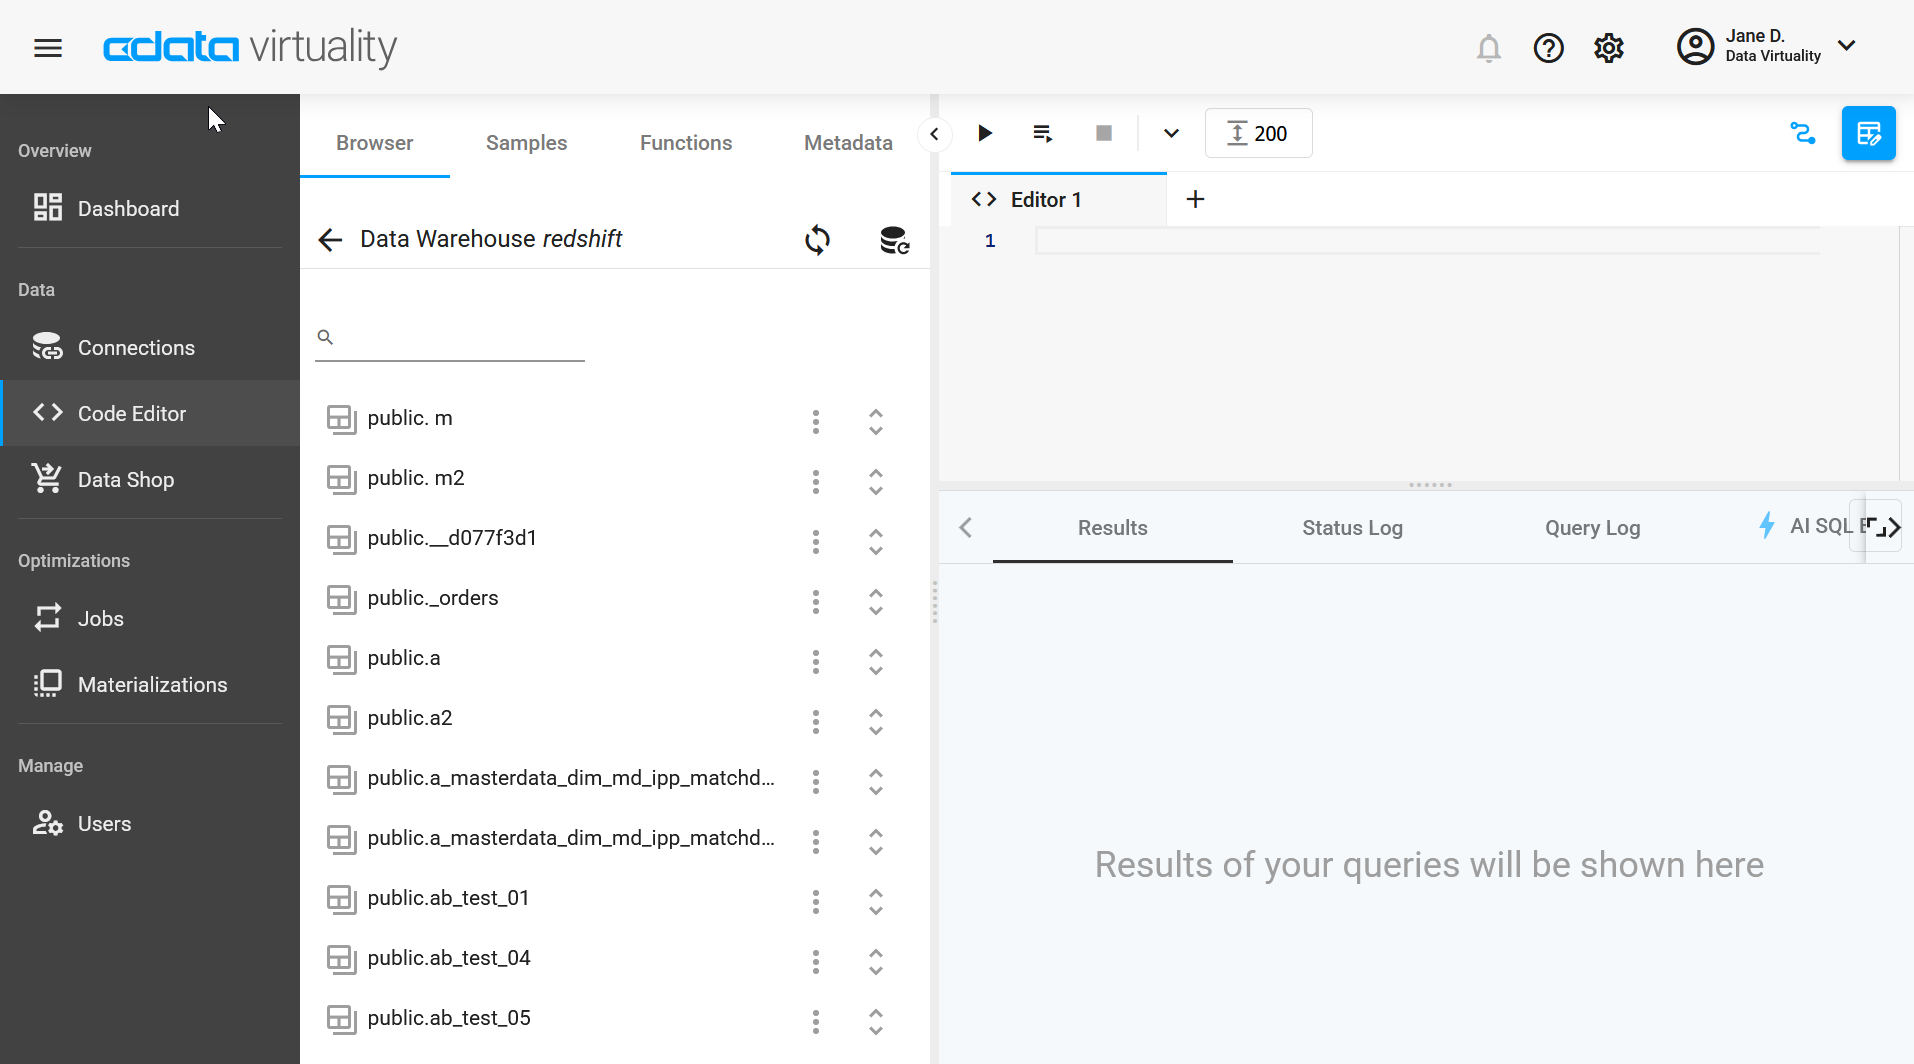
Again, clicking on the three-dot icon will open a list of available actions:
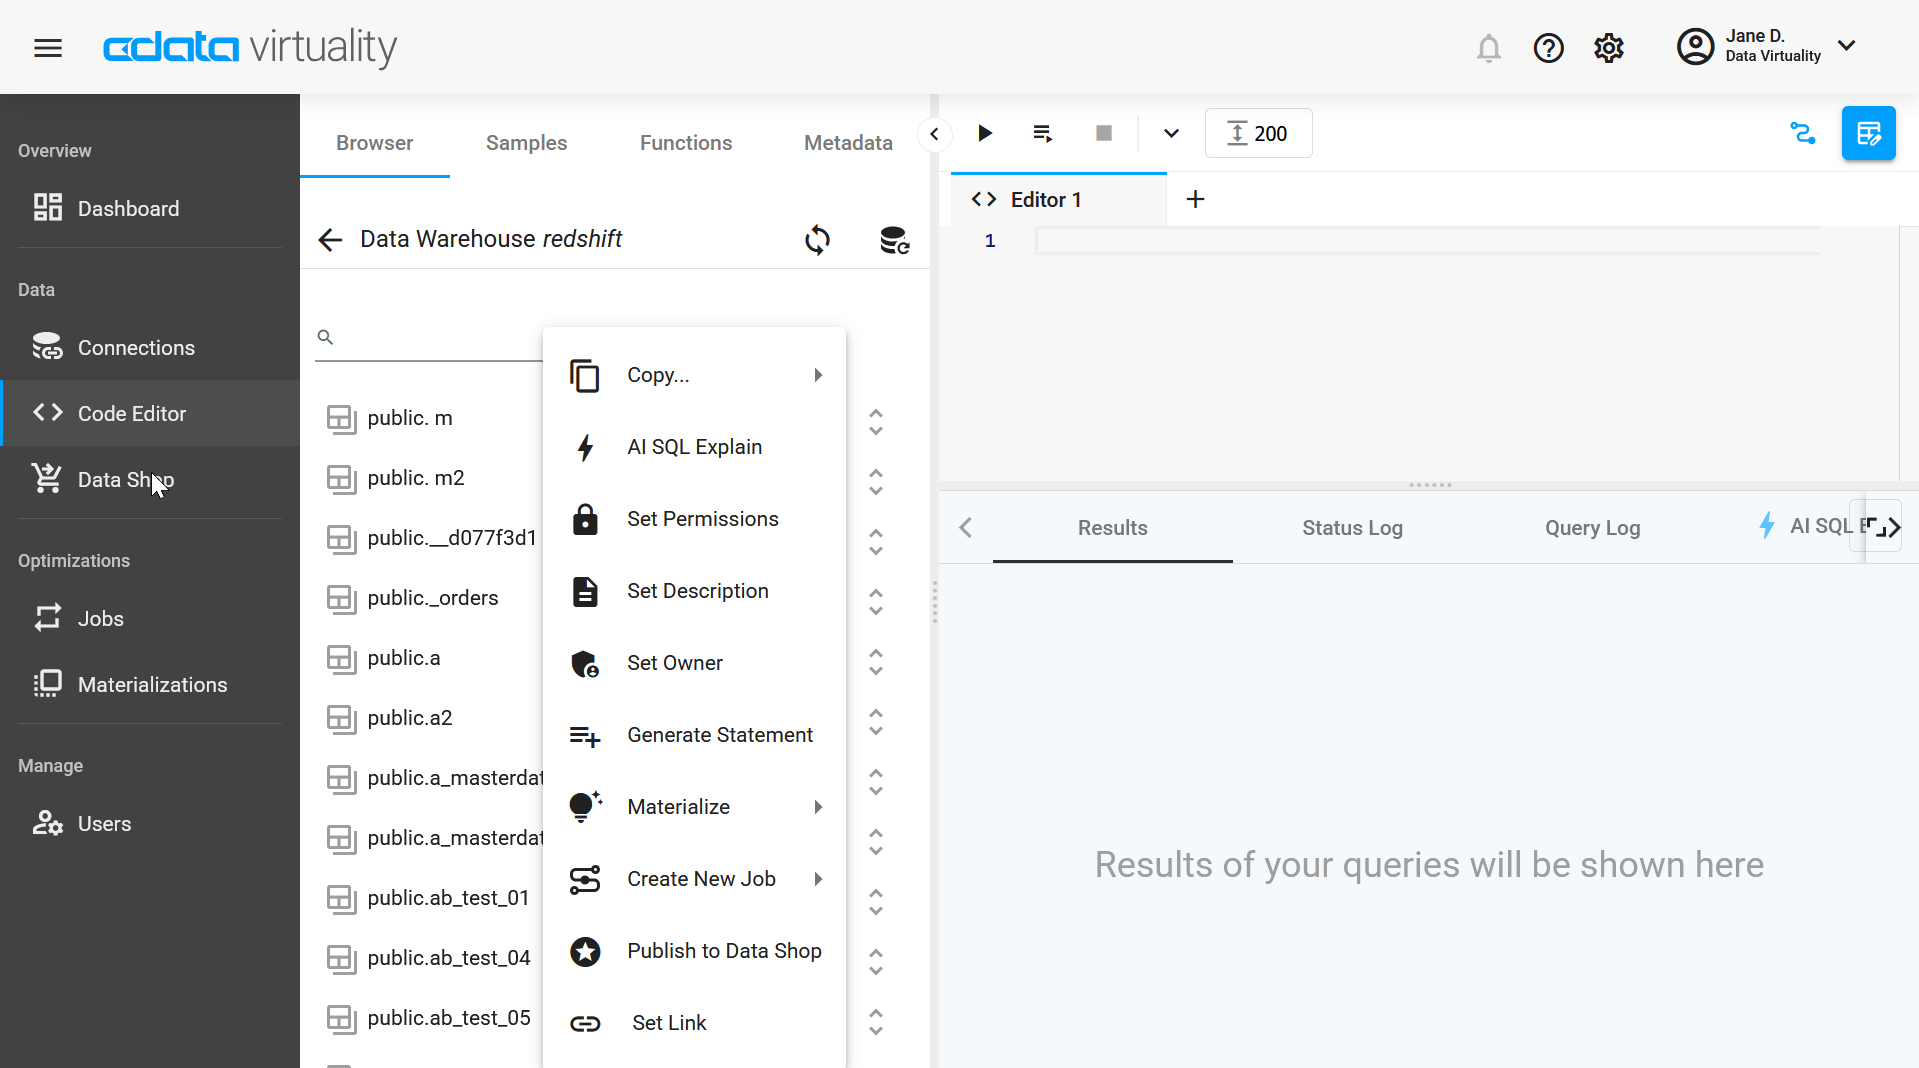
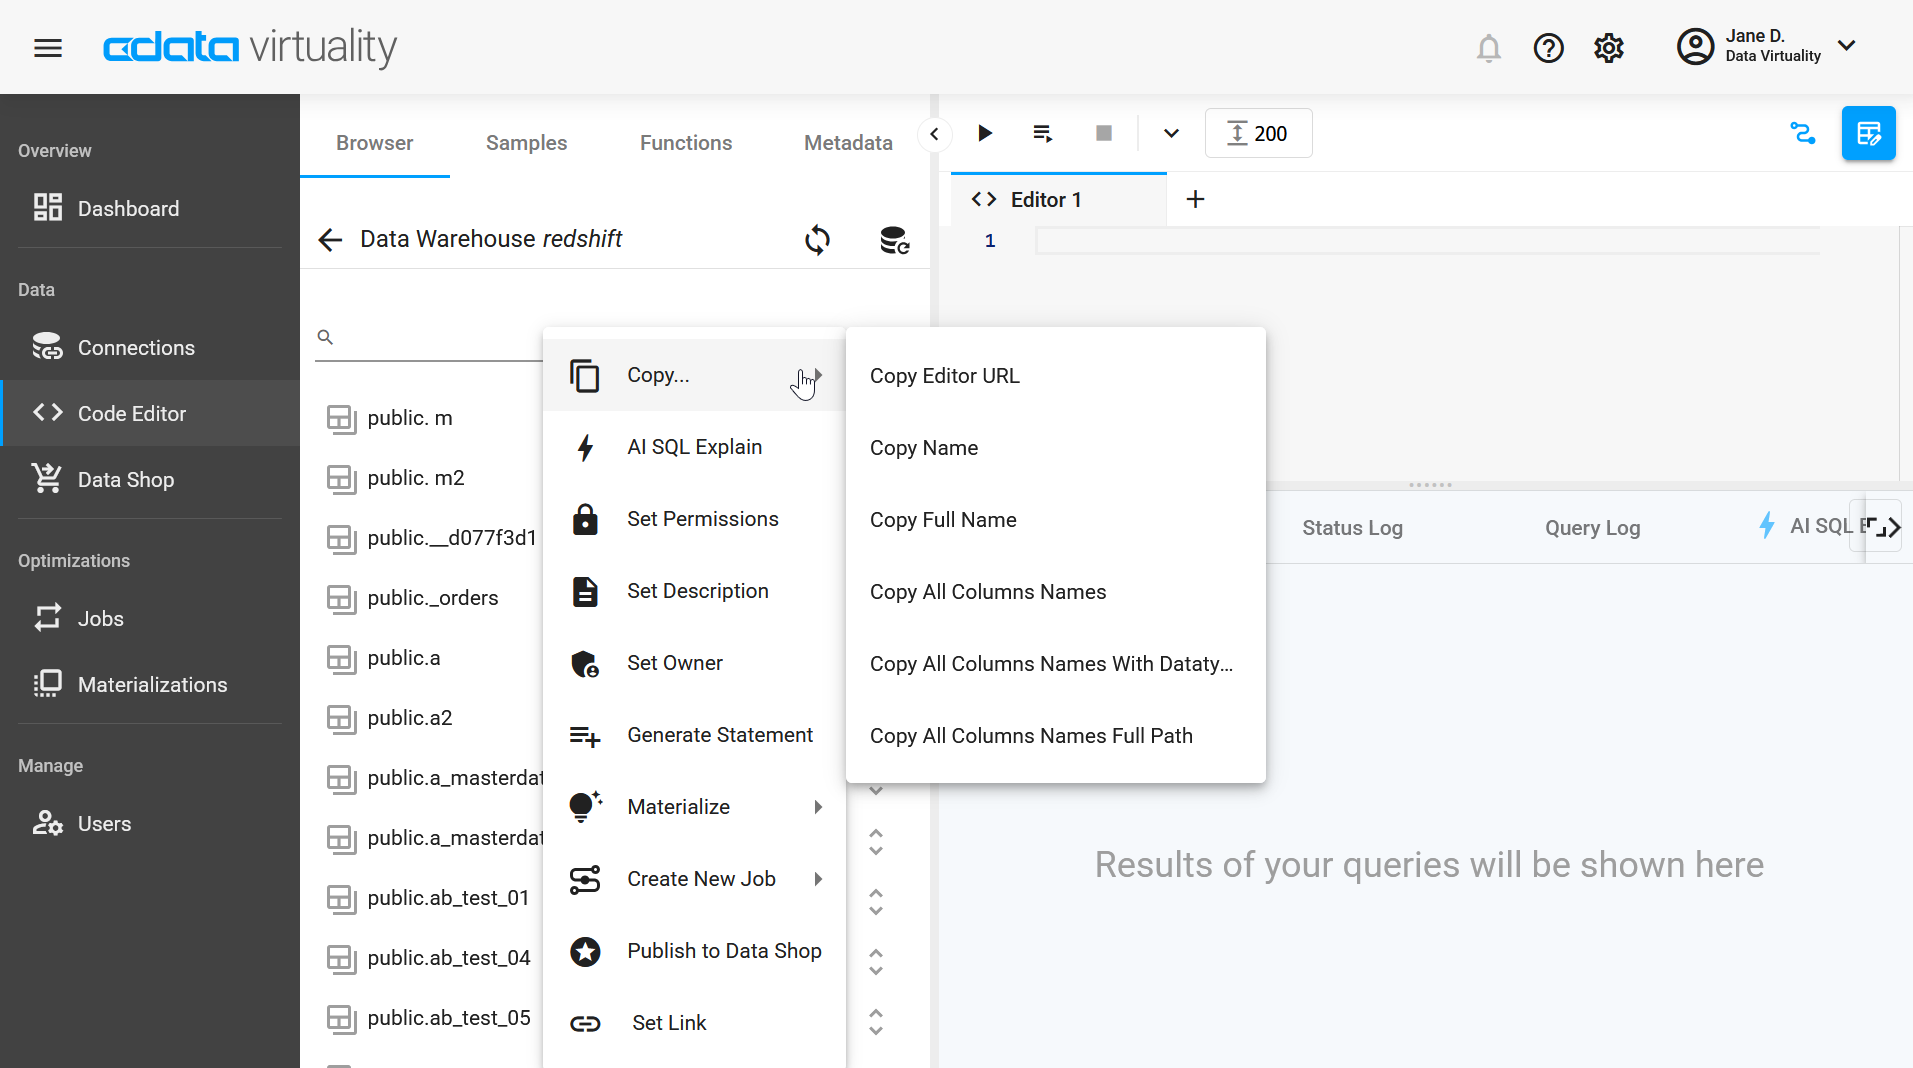
For some of the actions, like Copy, additional actions are available:
Samples
This tab shows examples of views, procedures, and functions which may come in handy when working with the CData Virtuality Platform. All examples are fully editable so that you can use them as the basis for your own queries.

Functions
This tab lists functions supported by the CData Virtuality Platform.
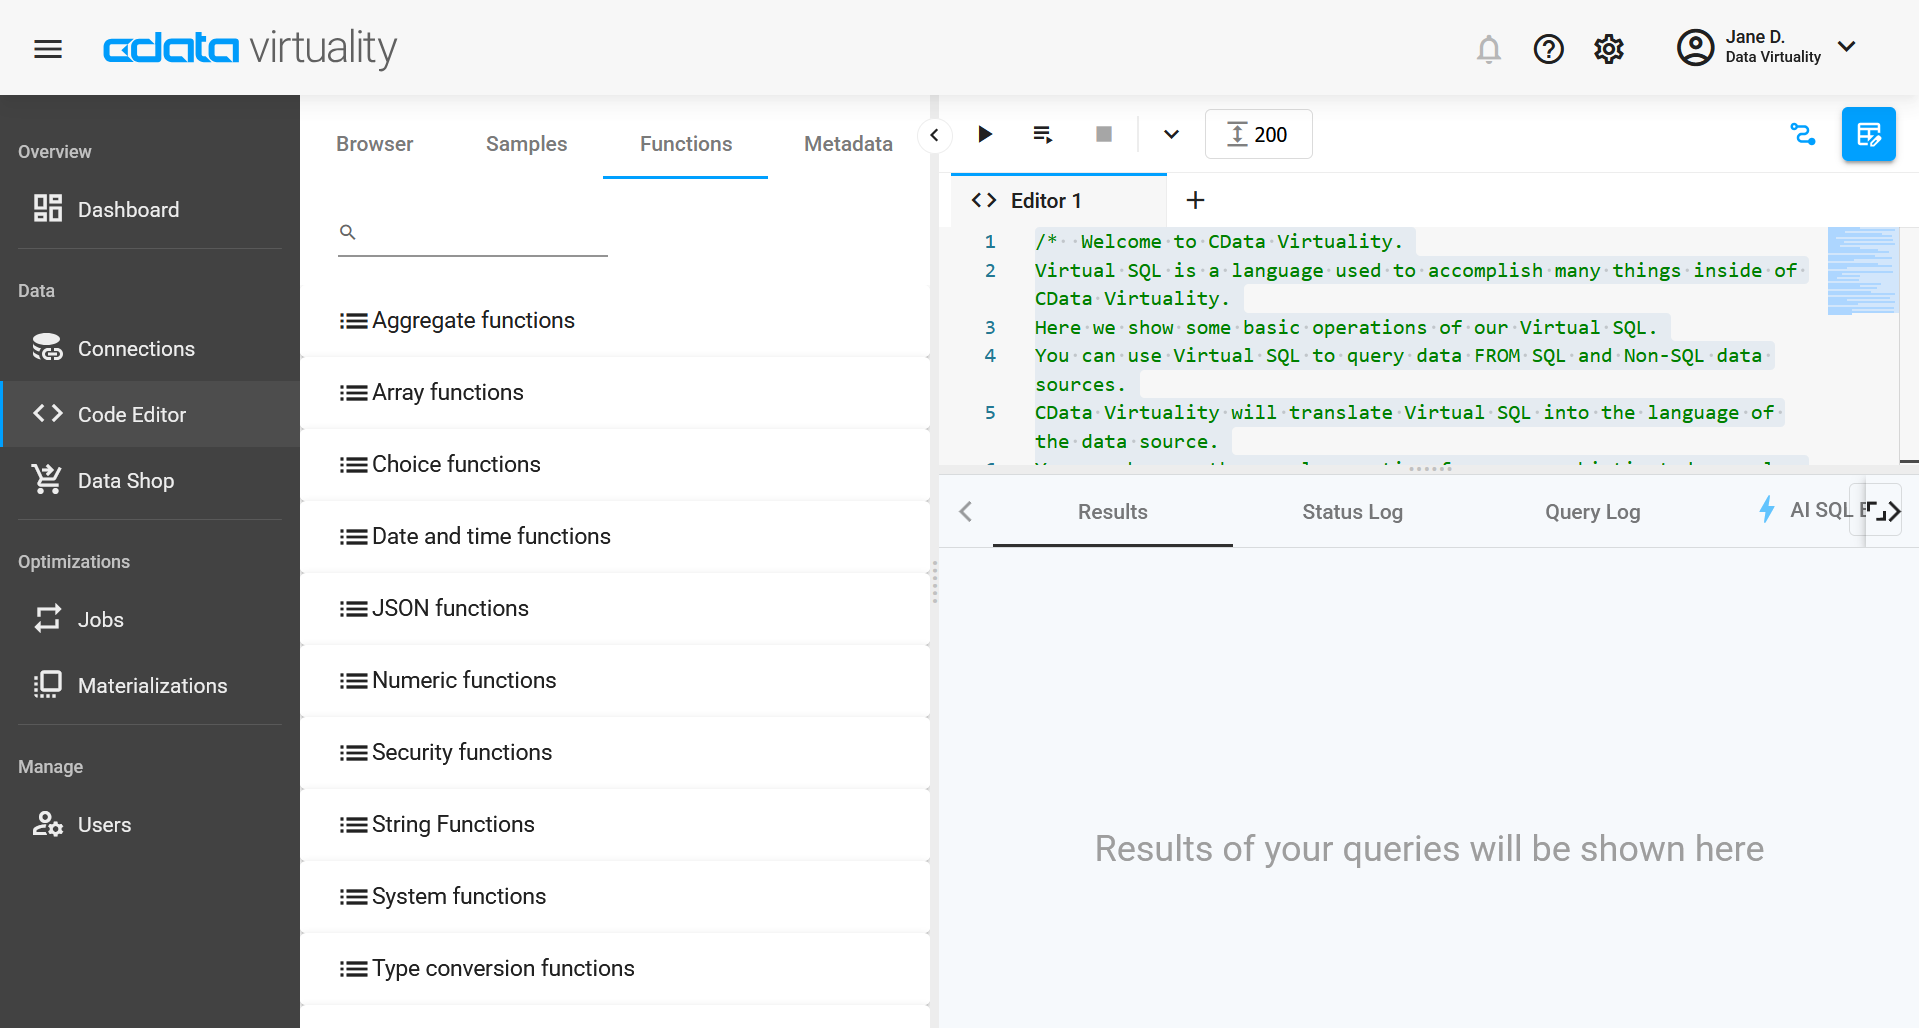
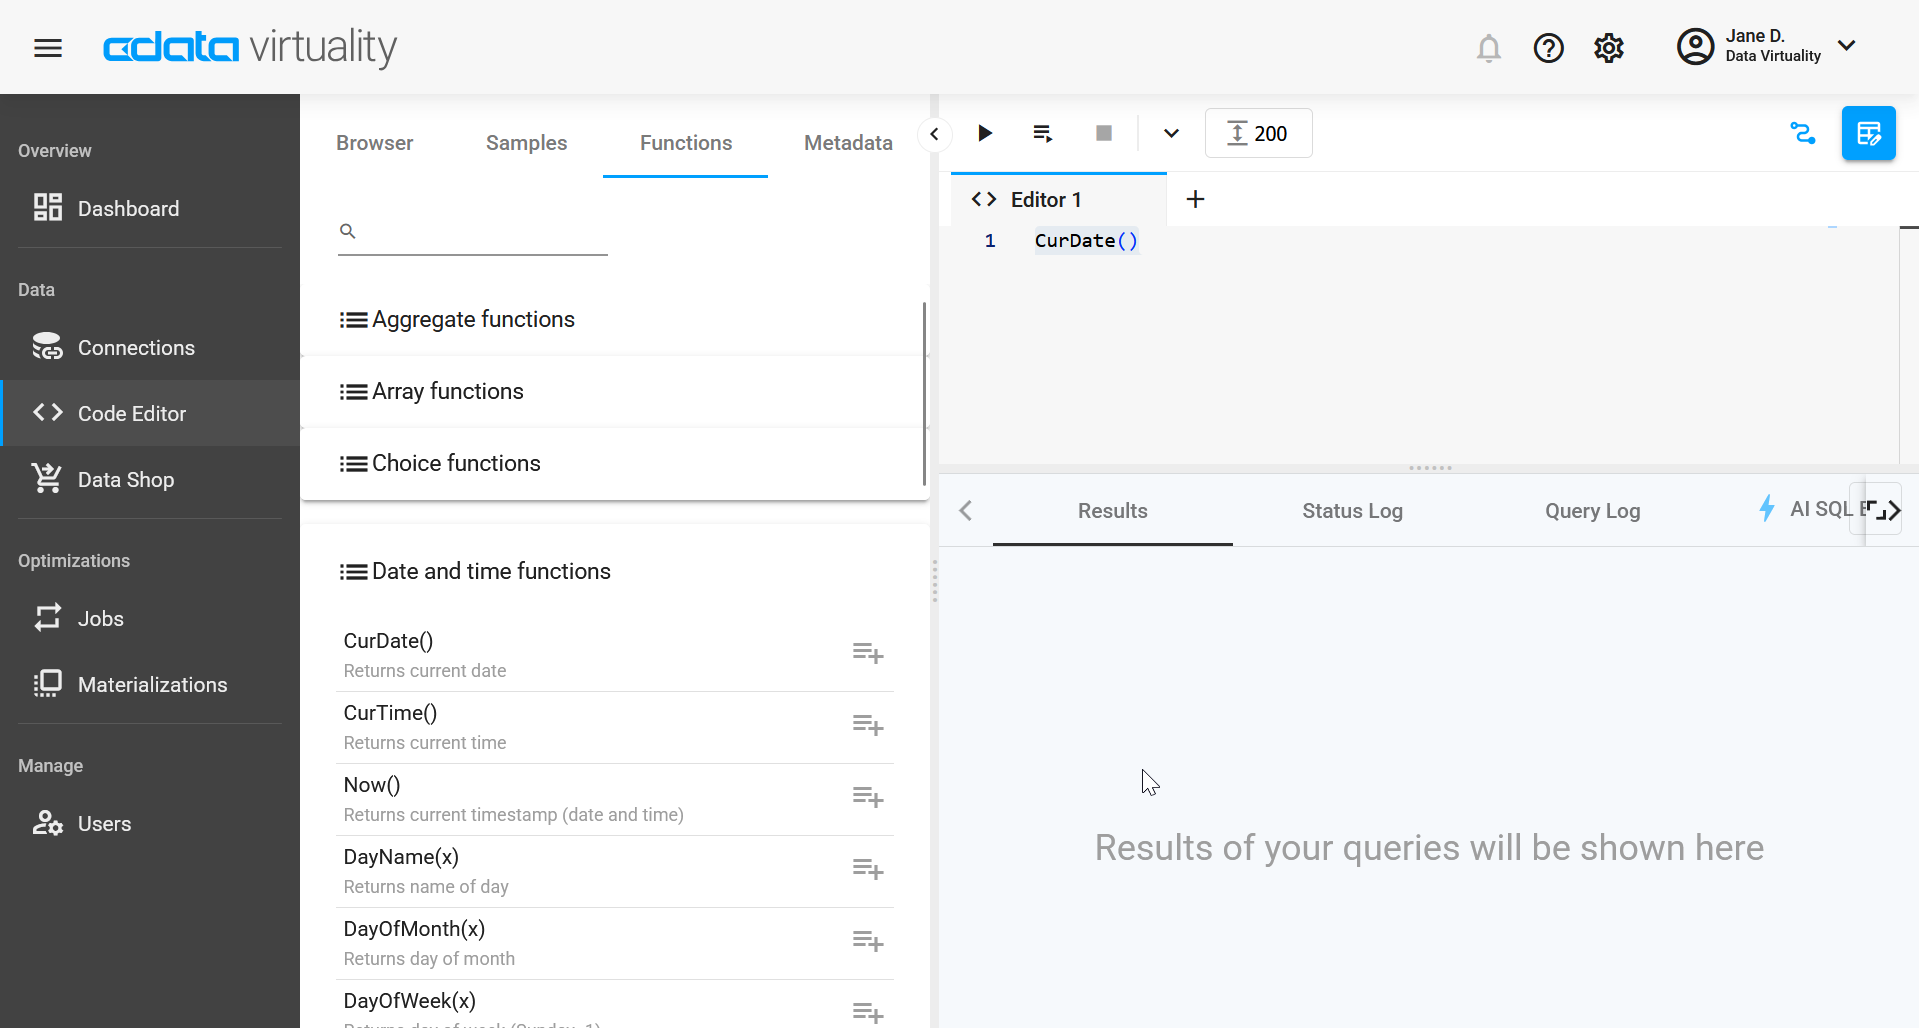
The functions are grouped by type, and you can expand the list by clicking on the type name:
Metadata
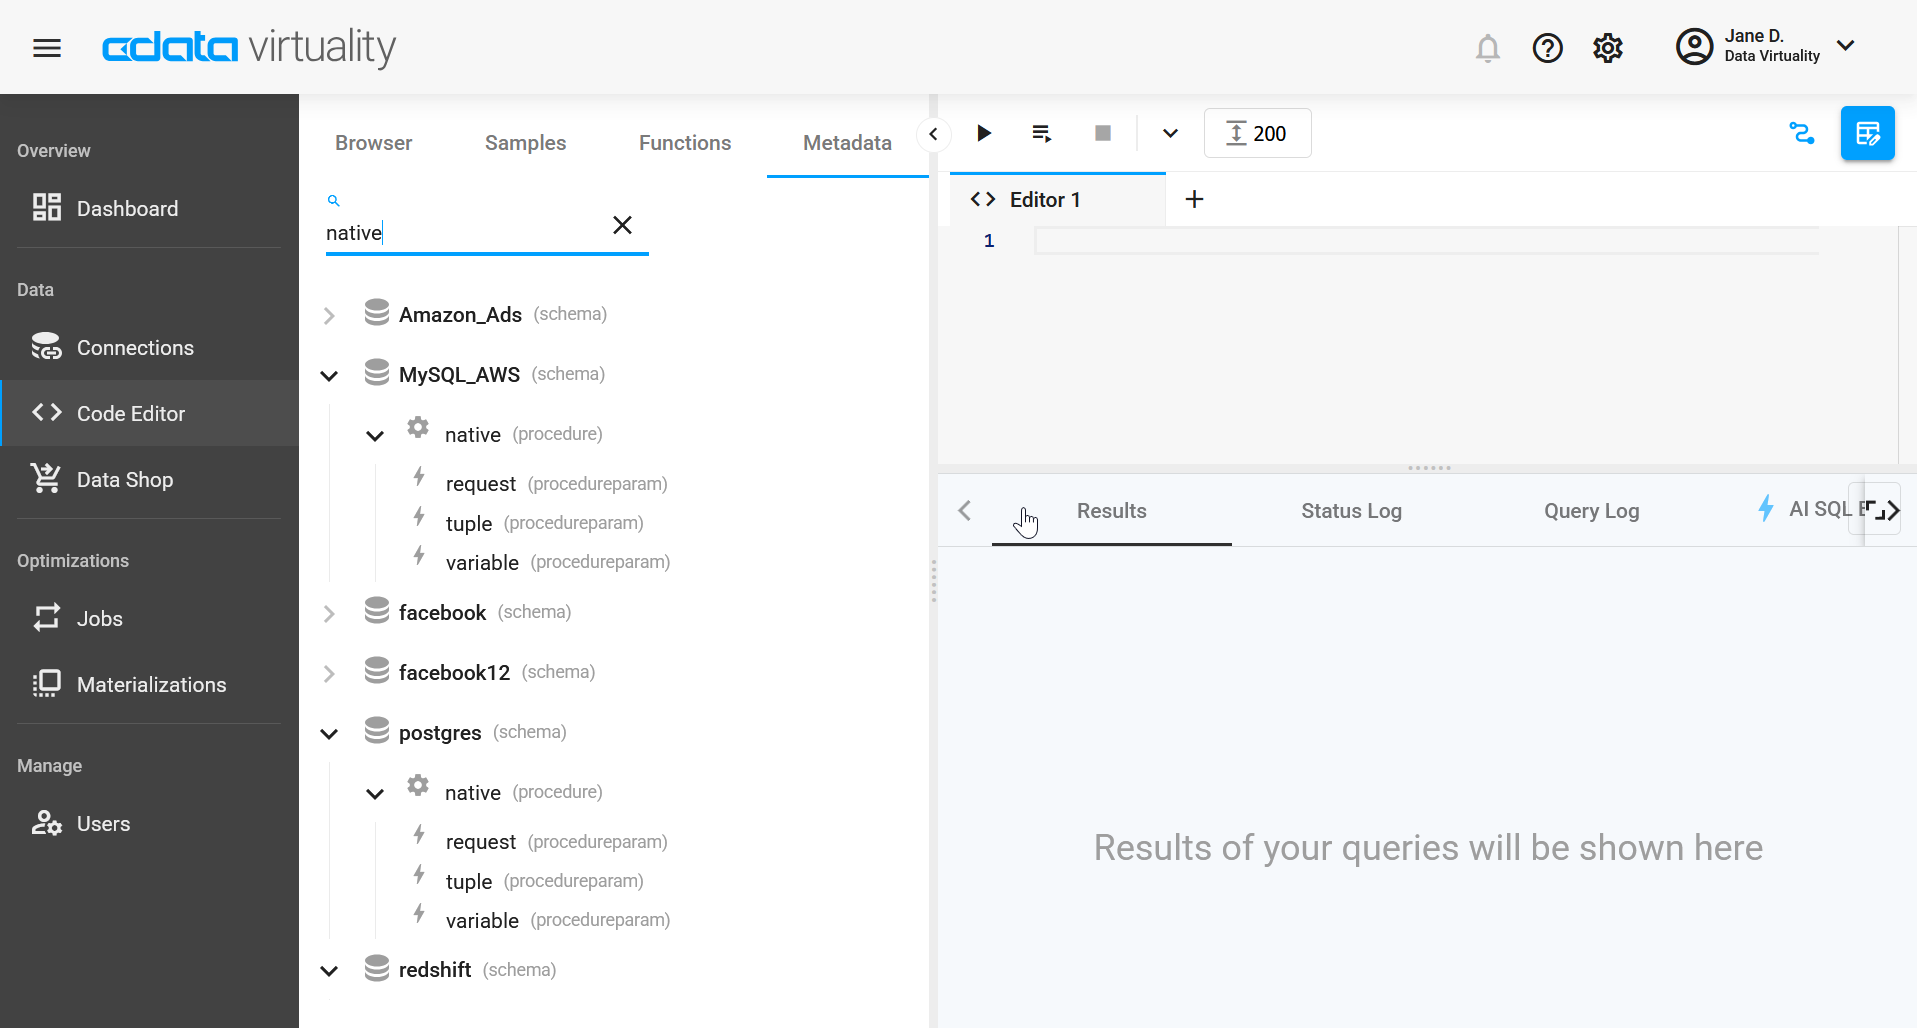
This tab is used to search for objects in the server’s metadata: you can enter the name of a table, view, procedure, or another entity, and get a list of all objects with this name existing in the server.
In this example, we search for objects with ‘native' in their name:
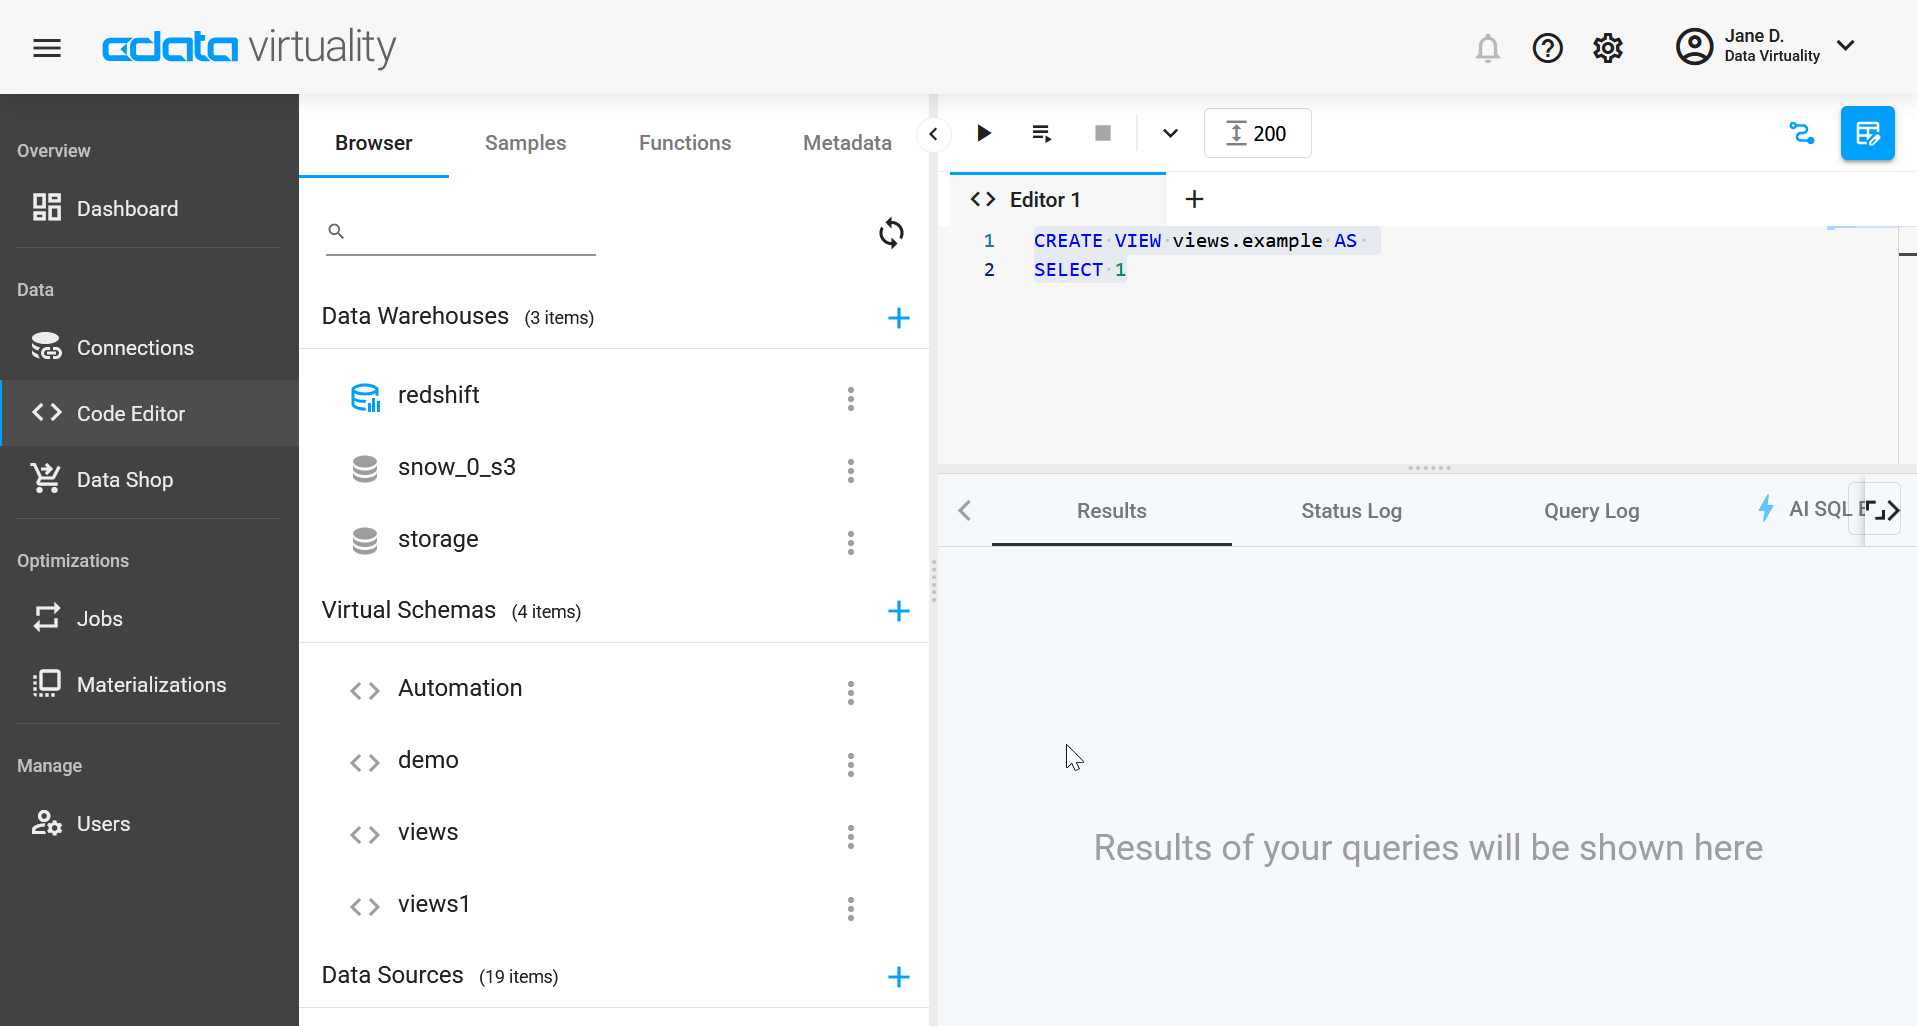
Code Editor Window
In the Code Editor window, ou can write your own query or generate one using the side panel. To run a query, click Run script or Execute selected. If you need more detailed reference information, you can find it in our Reference Guide.
By default, the result code editor window is set to 200, and you can change it to any number between 1 and 500 - type the desired number instead of 200.
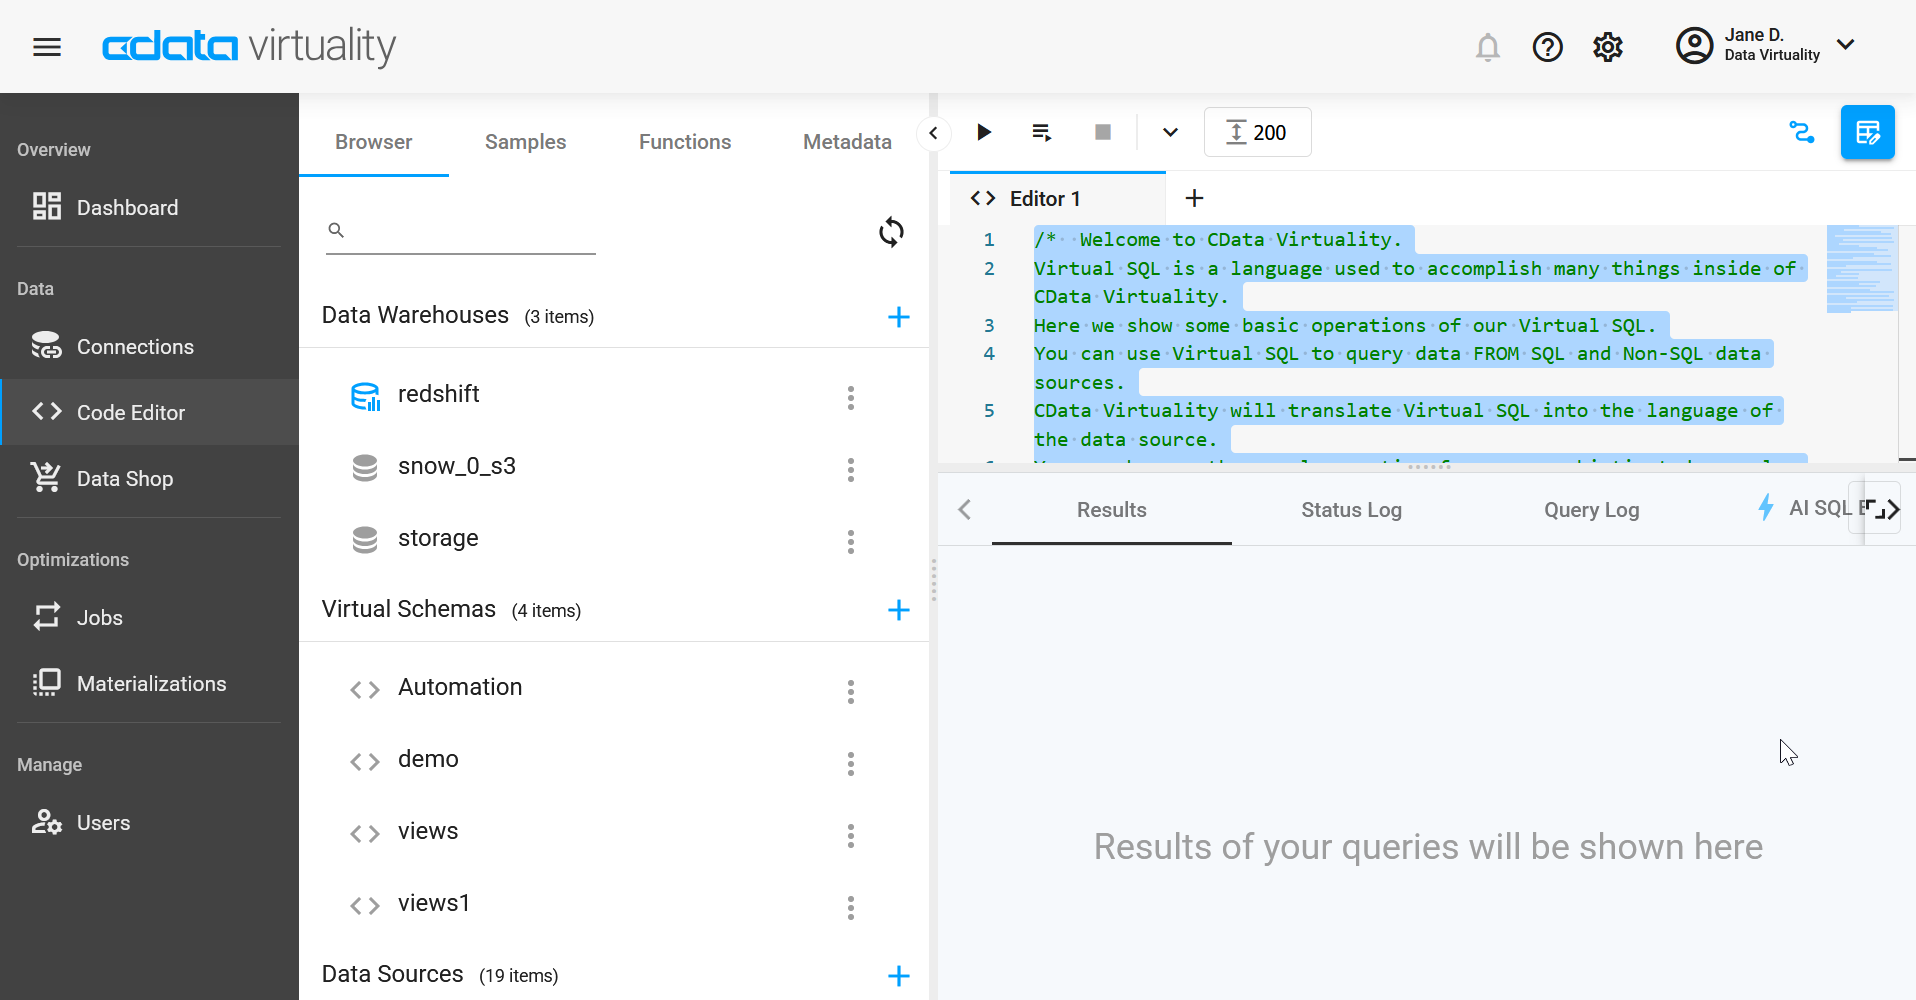
The SQL dialect used by the Code Editor is a special Virtual SQL dialect. You can use it to query data from SQL and non-SQL data sources; CData Virtuality will translate Virtual SQL into the data source's language. The Code Editor also includes a basic intro to our Virtual SQL - you will see it the first time you open the Code Editor.
To clear the Code Editor window from all text, click the X button above.
Under the Code Editor window, you have four tabs with information on the queries you run: Results, Status Log, Query Log, and AI SQL Explain (preview feature).
The AI SQL Explain feature is disabled by default. To enable it, you can go to Preferences → Code Editor and toggle the switch. You can also tweak other settings and choose to auto close brackets and quotes, wrap text, and close tabs without confirmation.