
Dashboard
The Dashboard is conveniently located on your instance's main page. It provides easy access to your instance information, settings, documentation, and help center.
Once set up, the instance normally does not require maintenance, but you can always check out the Dashboard to see what's going on with your installation. Here is how the Dashboard looks once you have set up your instance:
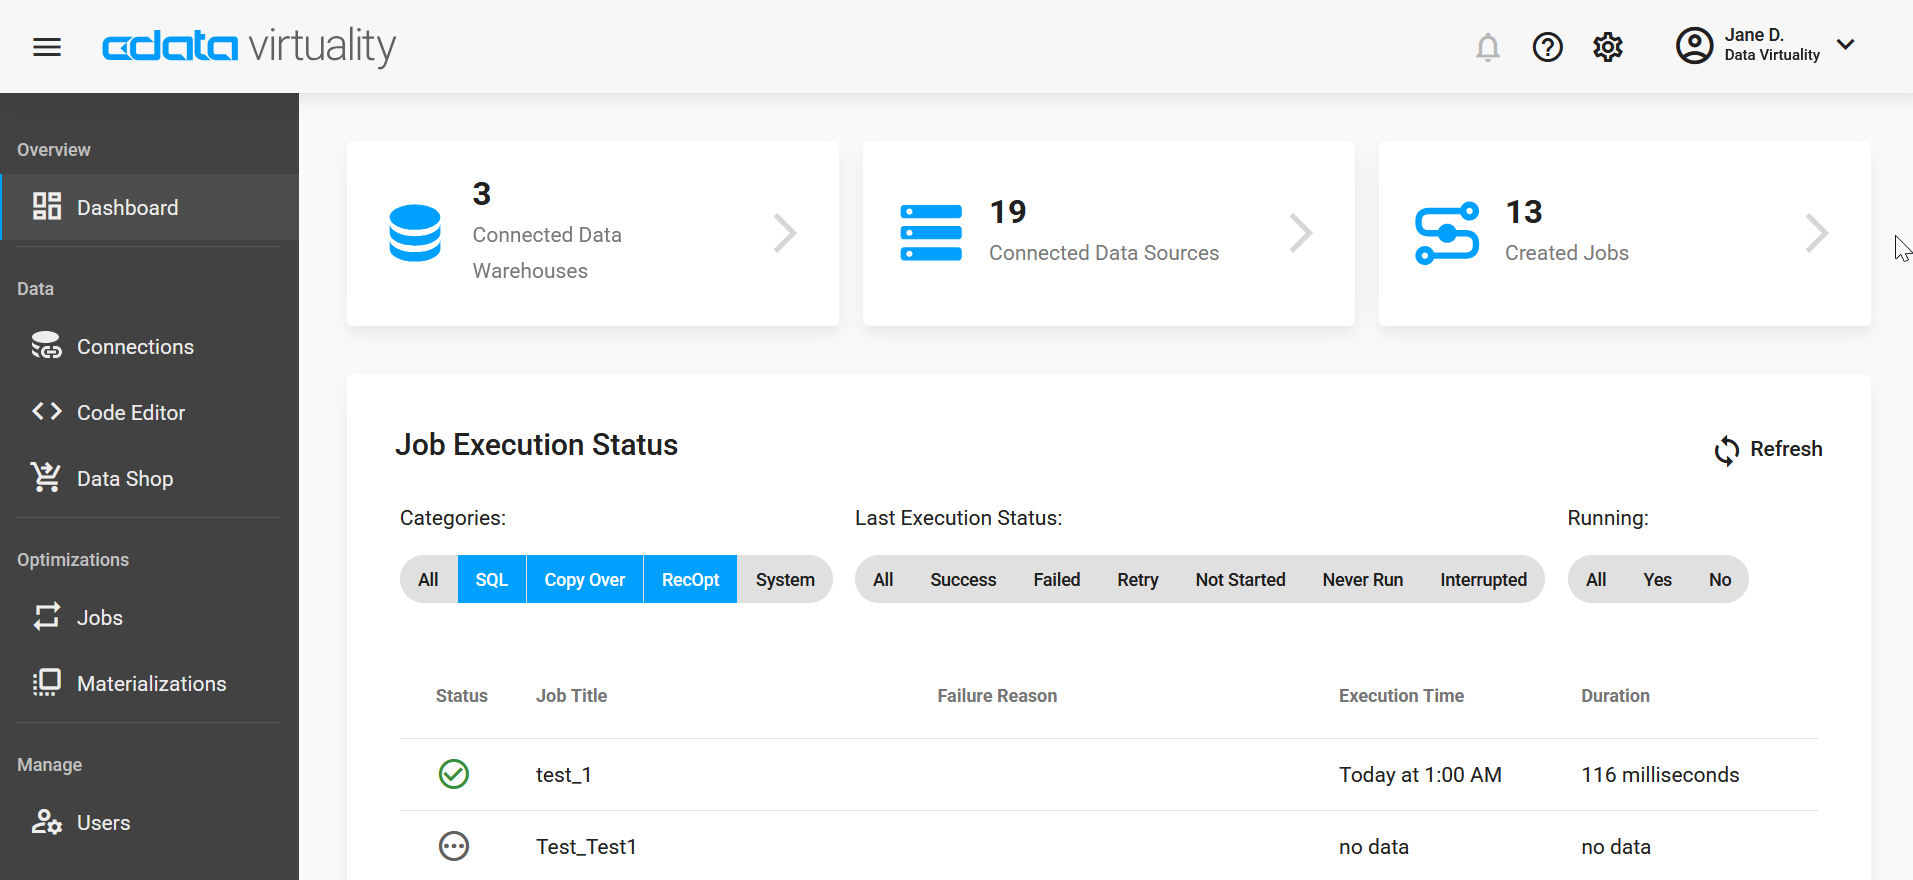
And here is what the buttons mean:
Button | Description |
|---|---|
X Connected Data Warehouses | Number of connected data warehouses (clickable button) |
X Connected Data Sources | Number of connected data sources (clickable button) |
X Created Jobs | Number of jobs configured, may be different from the number of sources (as there can be several jobs connected to a single source) |
All runs for the past 24 hours are recorded in the log below. The default number of items per page is 10, but it can be changed to 50, 100, or 250. You can select jobs to be displayed according to their category, last execution status, and running status - all buttons are clickable.
By default, the entries are organized from the most recent to the earliest, but you can sort them in any order you need. Every entry includes the following information: status (successful or failed), title, failure reason (if the run has failed; if the run has been successful, is displayed in this column), execution time, and duration.
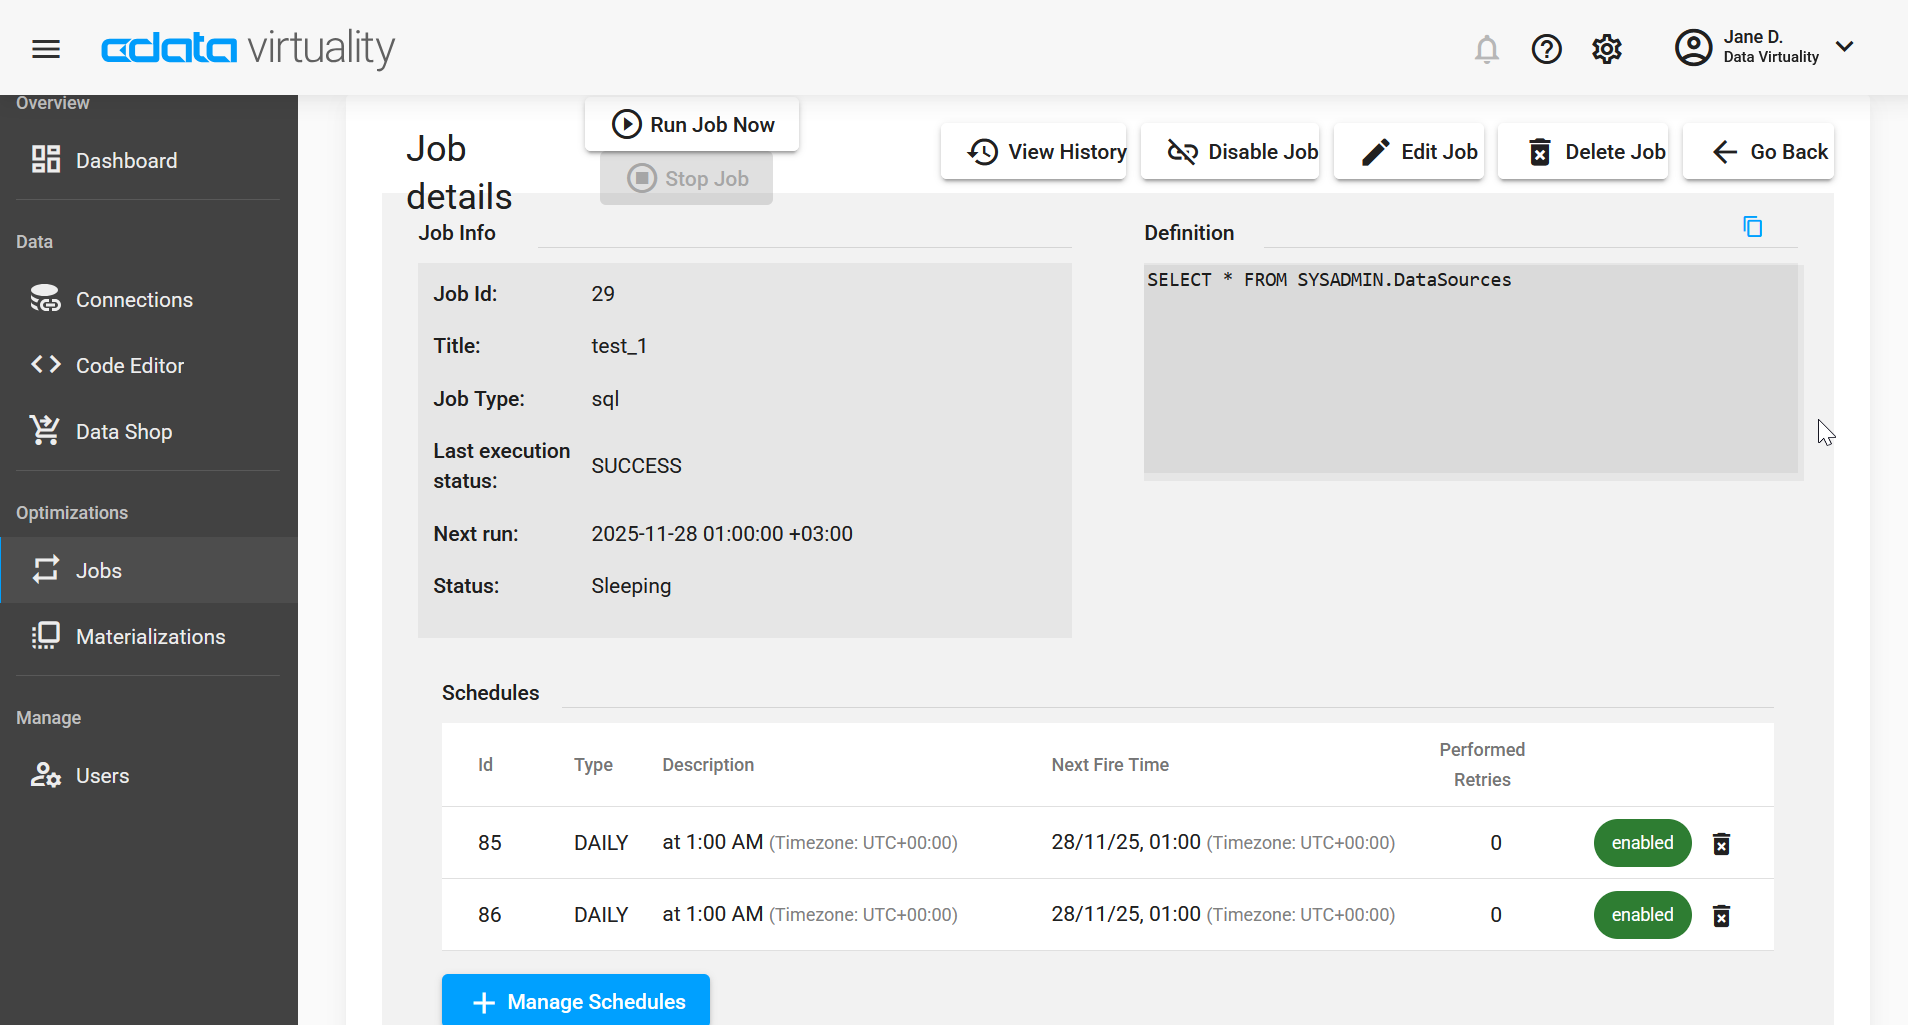
If you need to view detailed information on any of the runs and/or change something (for example, manage its schedule), click on the relevant row in the table. The following window will open:
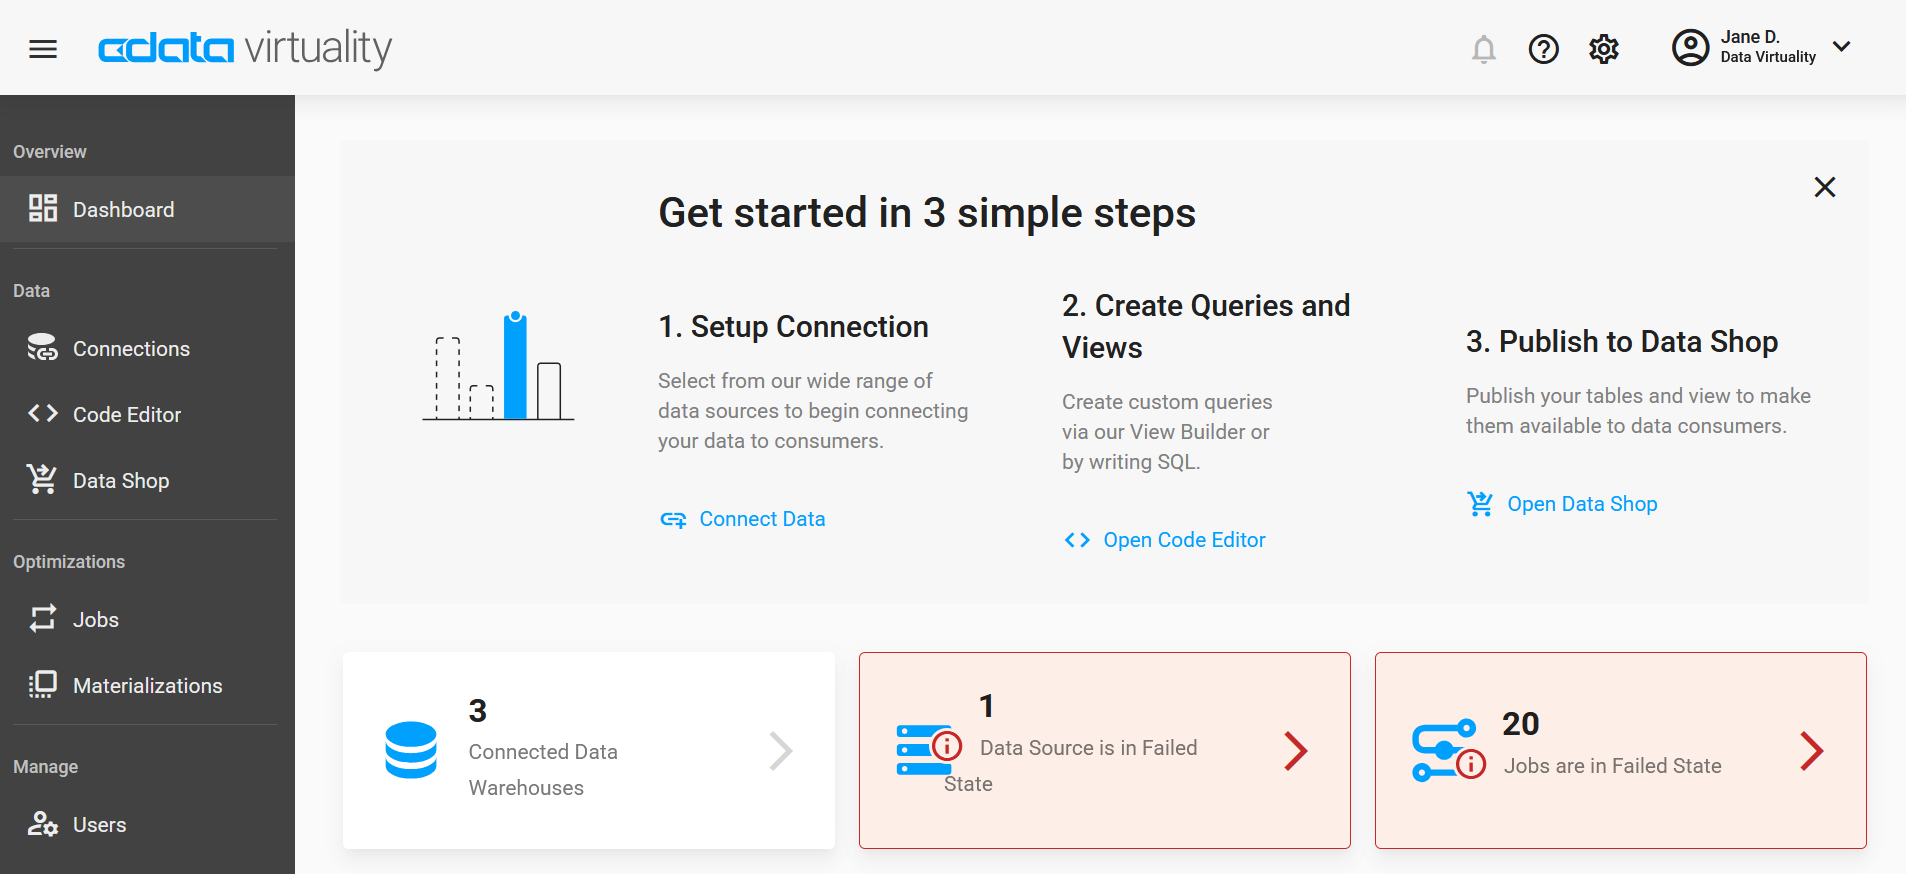
If something has gone wrong with a data source or a job, this information will be displayed on the Dashboard instead of the number of connected data sources and jobs:
You do not have to check the Dashboard now and again to see how things are going, though: you can set up notifications and get a message if something requires your attention (please see the dedicated section for more information on notifications and how to set them up).